Paid time against contact time, and travel
How much of our carers' working time is travel, are visits as long as planned, and does unpaid travel take anyone below the minimum wage?
Upload a visit log and carer payroll. Ask Orrery compares planned and actual visit minutes, totals travel, and works out each carer's average pay across all working time.
When people use it: Monthly, and before any HMRC or council audit.
How it works, step by step
Upload visits and payroll
Travel recorded in your rostering system is enough.
Visit length
Short visits against plan affect quality and what councils pay for.
Pay across all working time
Travel between visits is working time for minimum wage purposes.
What you upload
- A visit log with planned and actual times and travel
- Carer payroll
Files are stored privately for your account, never shared with anyone and never used to train AI. You can delete them at any time. Spreadsheets, CSV, PDF and Word files all work, in your own layout.
Try it with sample files
Made up files for a made up provider, Example Care Group, so you can see what Ask Orrery does with them.
Questions you can ask
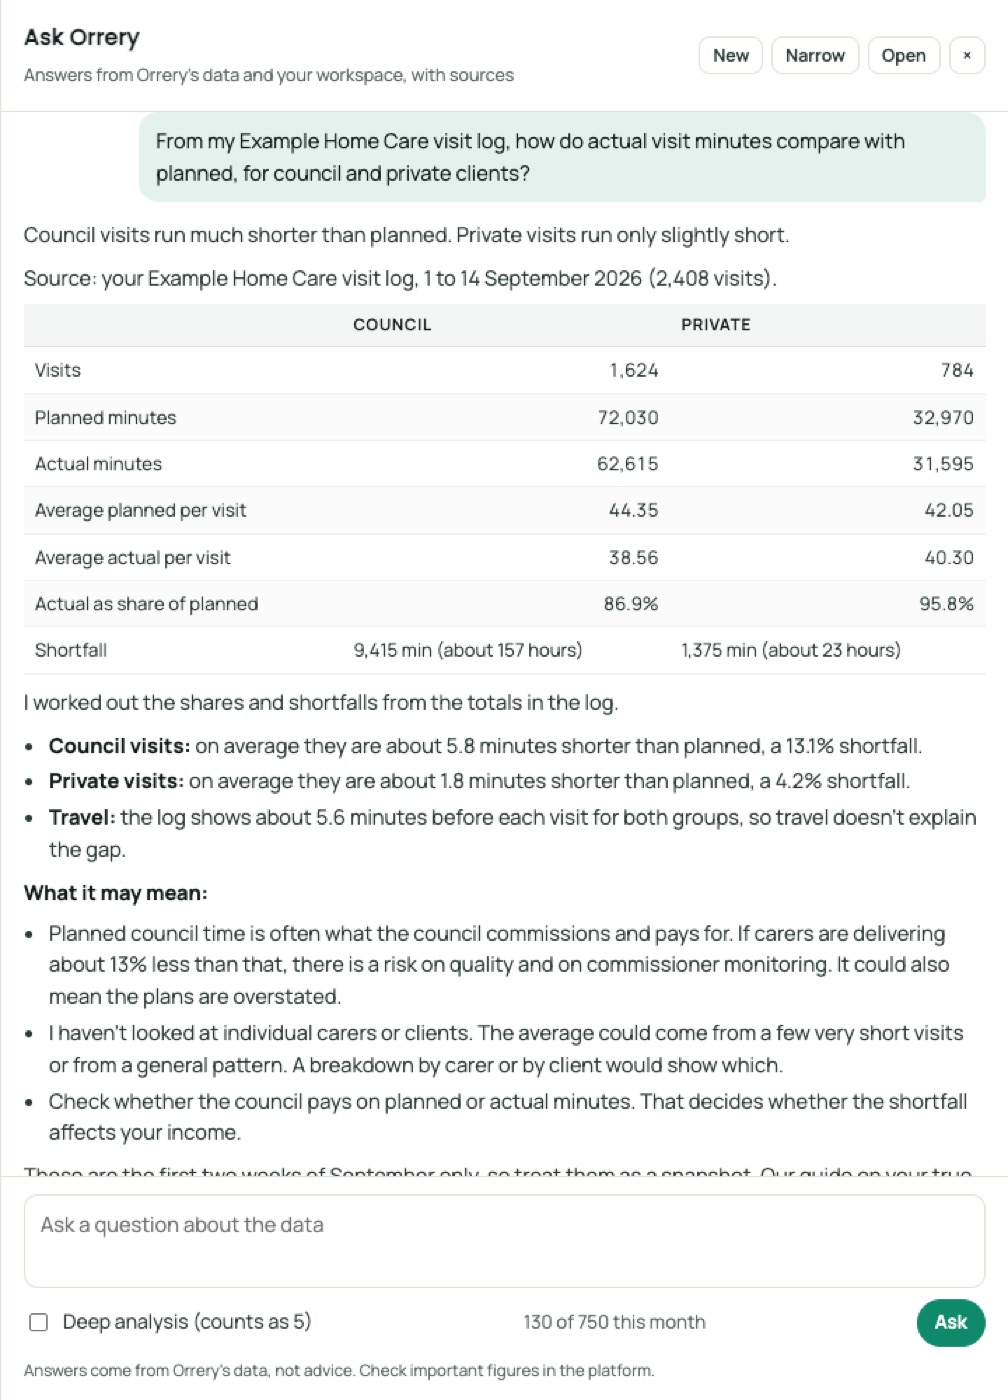
- “From my Example Home Care visit log, how do actual visit minutes compare with planned, for council and private clients?”
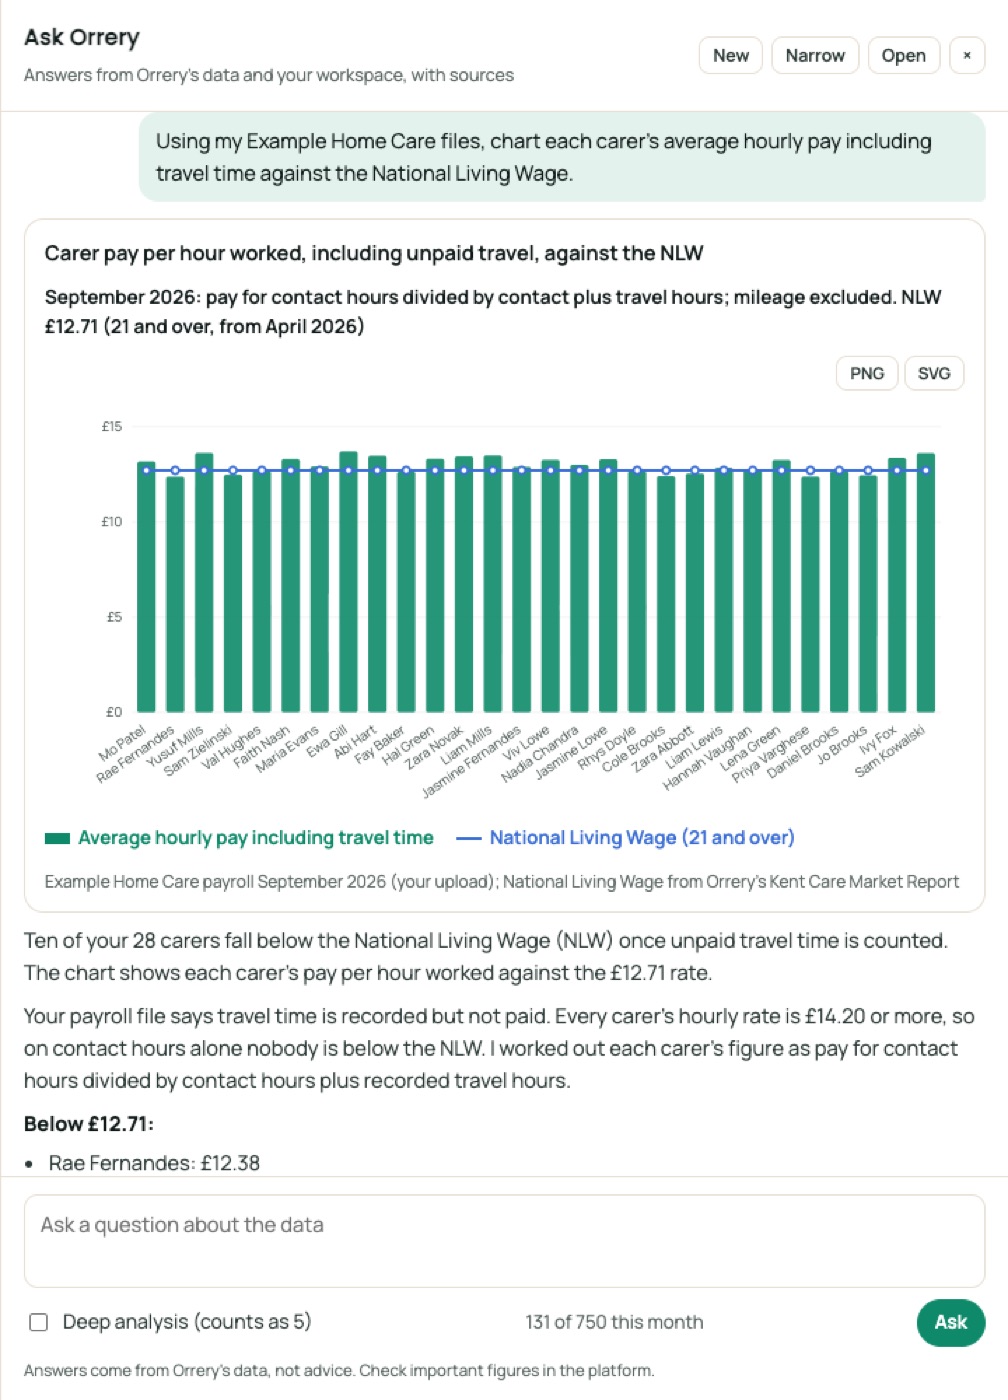
- “Including travel time, what is each carer's average hourly pay for September, and is anyone below the National Living Wage?”
Ask the data in plain English
A real question and answer from Ask Orrery, the assistant inside the platform, using the Example Care Group sample files above (October 2026). It works from your files and Orrery's data, and shows its sources.
Council visits ran much shorter than planned, and private visits ran only a little short. The figures are from your Example Home Care visit log, 1 to 14 September 2026, covering all 2,408 visits.
| Council | Private | |
|---|---|---|
| Visits | 1,624 | 784 |
| Planned minutes | 72,030 | 32,970 |
| Actual minutes | 62,615 | 31,595 |
| Shortfall | 9,415 (13.1%) | 1,375 (4.2%) |
| Average planned per visit | 44.35 | 42.05 |
| Average actual per visit | 38.56 | 40.30 |
| Average shortfall per visit | 5.8 | 1.8 |
Across both groups, actual time was 94,210 minutes against 105,000 planned, a shortfall of about 10.3%.
What this shows
- Council visits lose about 5.8 minutes each, which is over three times the private loss.
- Council clients account for 87% of the 10,790 minutes lost (9,415 of them).
- Travel before visits is almost identical for both groups, at about 5.6 minutes a visit. Travel does not explain the gap.
What to consider
- Council visits that run short may be cut short by carers, or the planned times may be too long. The log can't tell you which.
- Commissioners often look at this when they review contracts. The time you actually deliver also affects your true cost per care hour.
- Check whether the shortfall is concentrated in particular carers, clients or times of day. I can break the log down that way if you want.
I haven't checked this against your payroll or the council rate. The "home-care-cost-per-hour" guide in Orrery covers that comparison.
Ask, chart and report, in plain English
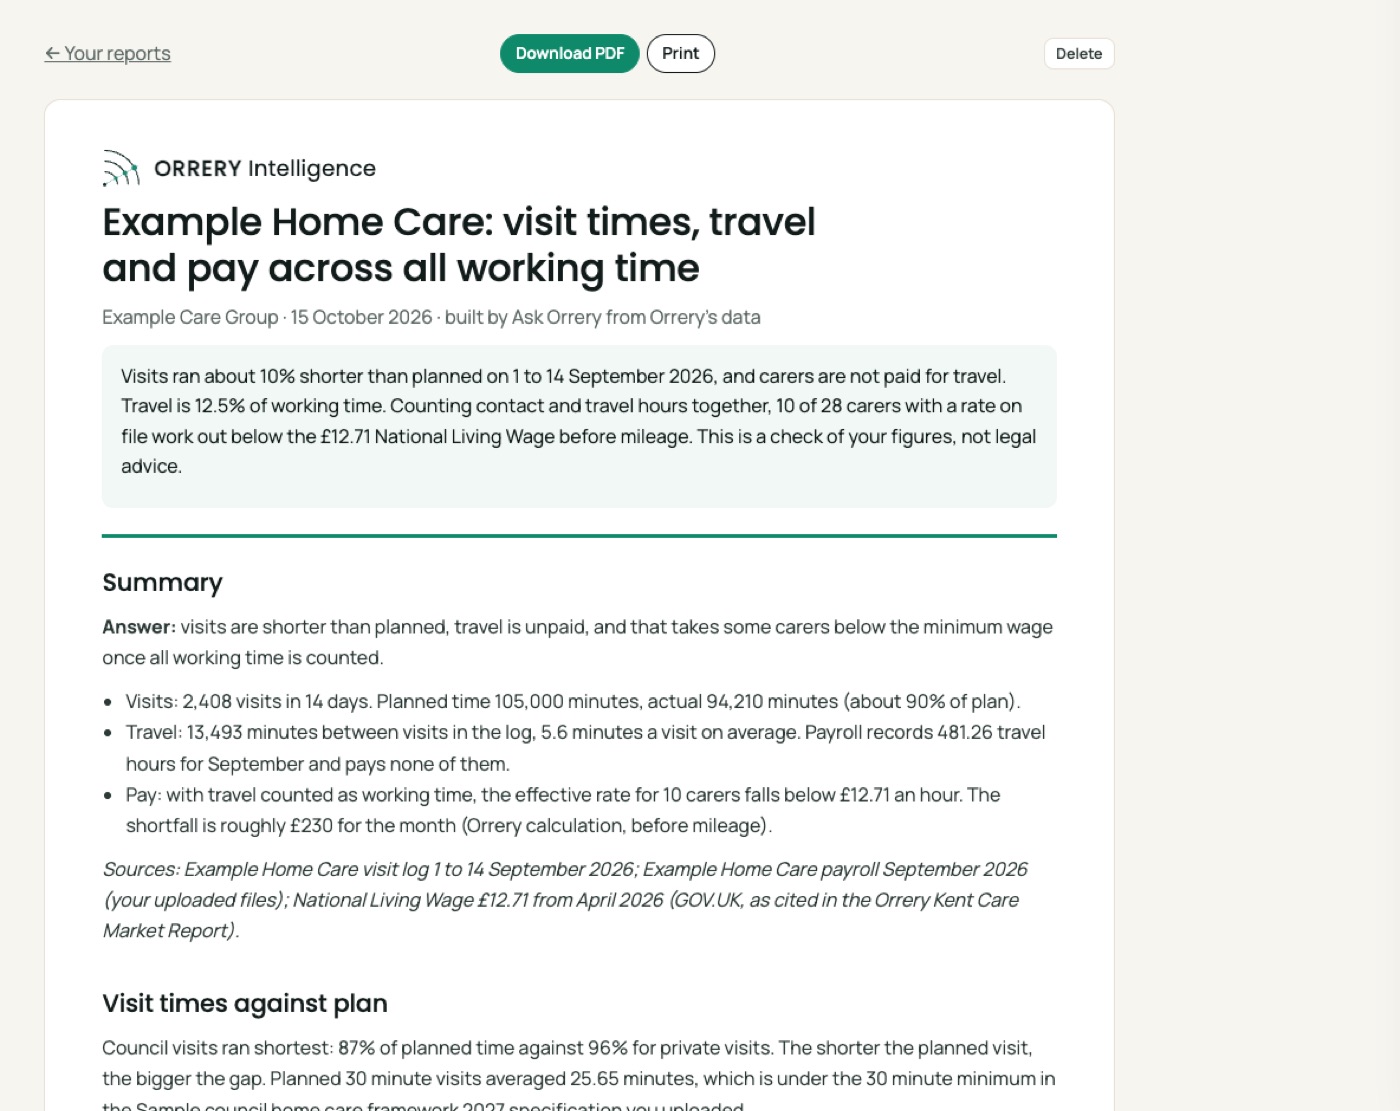
Ask Orrery answers from Orrery's data and your own files, draws charts on request and builds reports you can save as PDF. These are real examples made with the sample files.
- This is a check of your figures, not legal advice; confirm with your payroll provider.
Answer this with your own files
Subscribers get every guide, chart and projection for all 153 councils, Ask Orrery with private uploads of their own files, and every council report.
The Orrery platform opens to subscribers shortly. Register and we will tell you first.
Register for early access