Lender assessing a care home loan or refinance
Is this home in a market that will keep it full and paying its debt for the term of the loan?
Test the local market under pressure: occupancy and supply trends, the council's fee record, the payer mix, and the home's margin in a downside case.
When people use it: At credit application, at each annual review and before refinancing.
How it works, step by step
The home and its operator
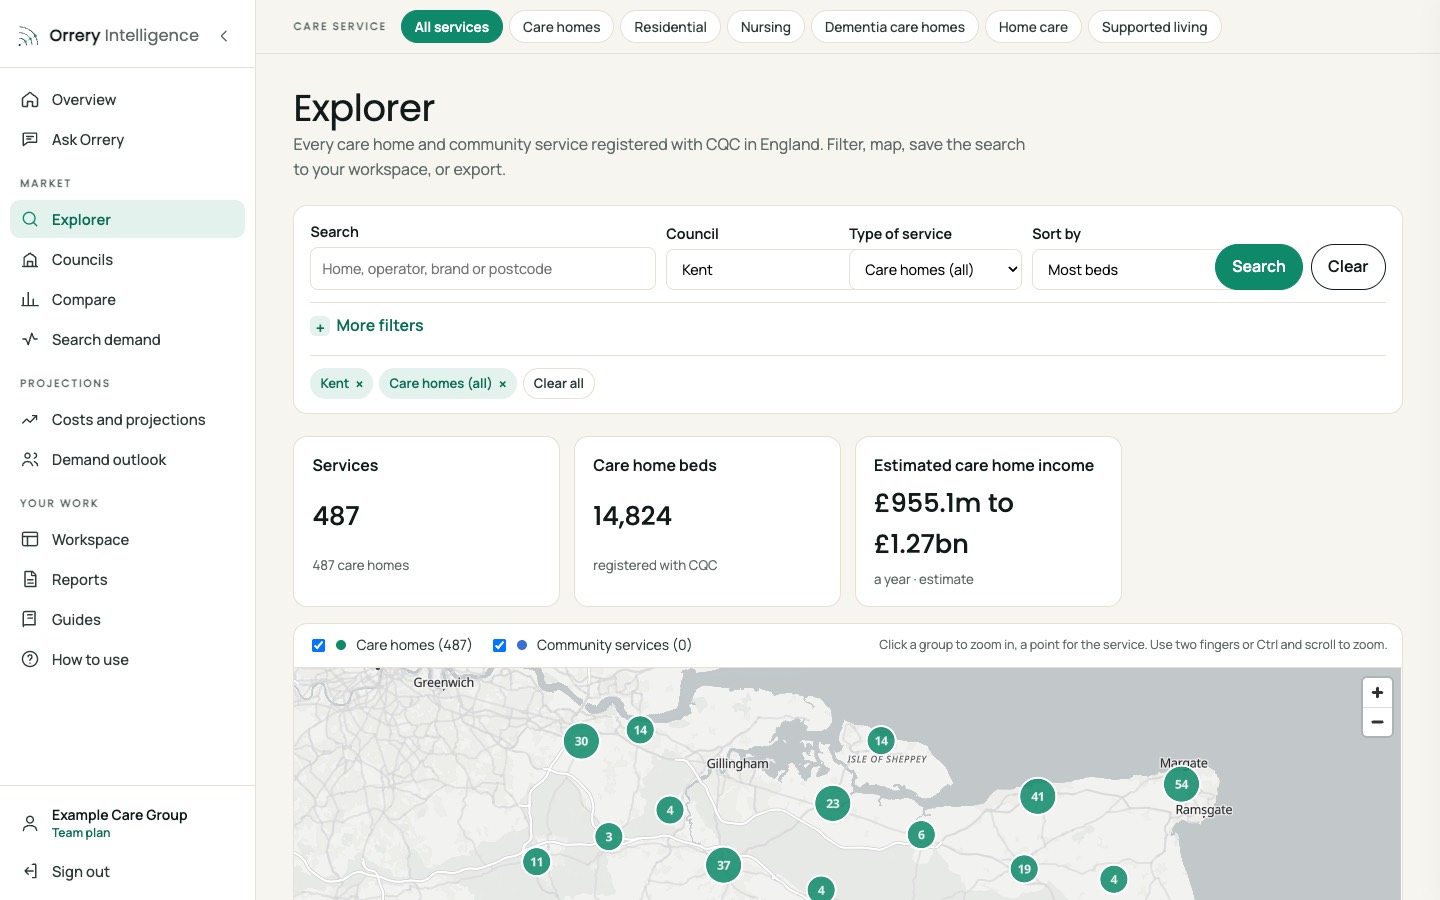
Find the home: rating, beds, registration date, operator size, and Companies House flags (charges outstanding, accounts overdue).
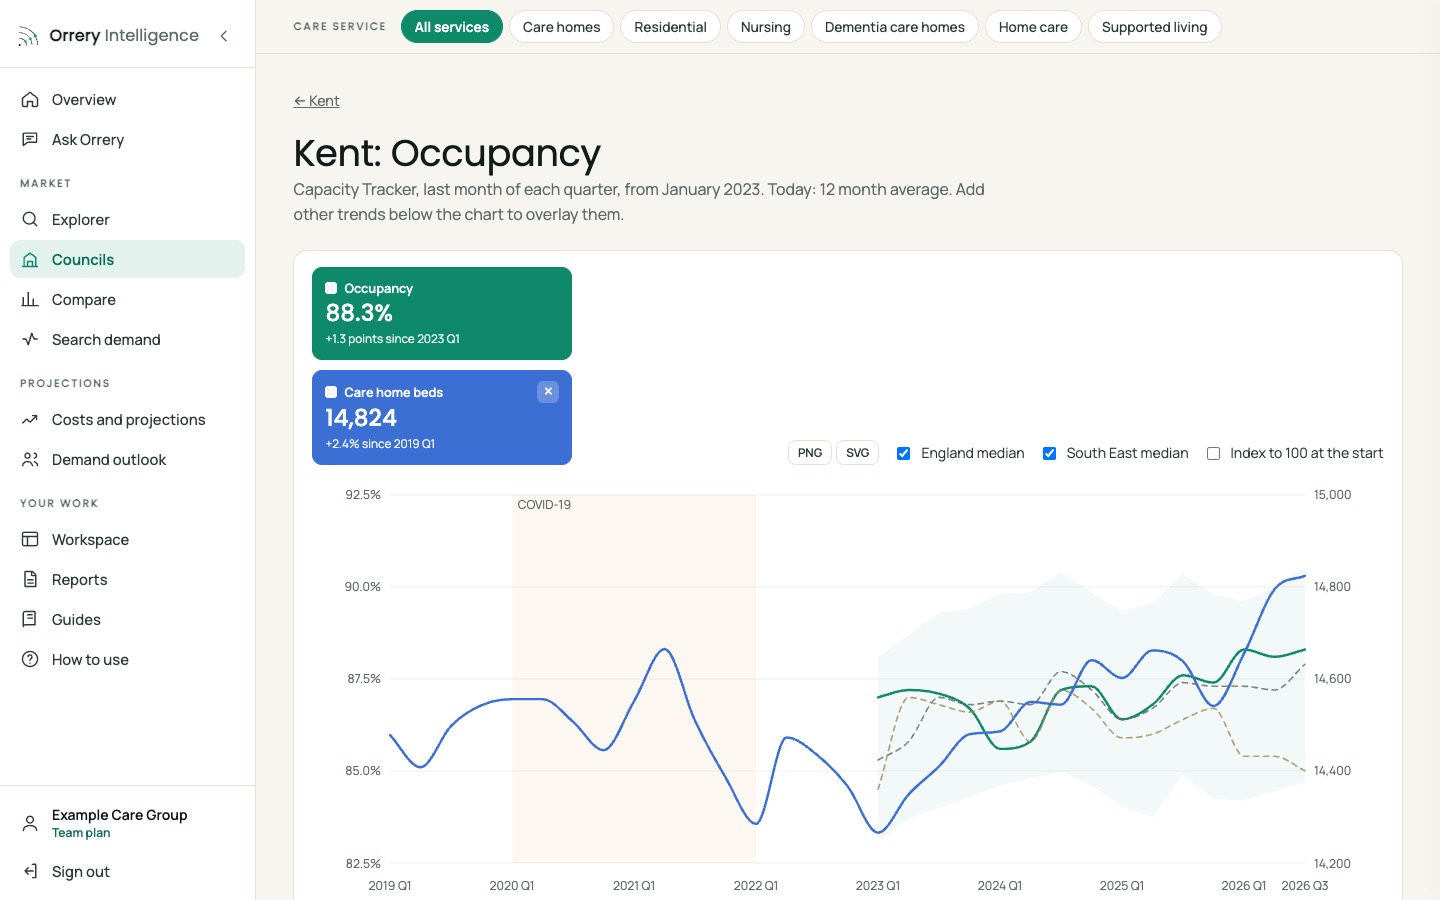
Occupancy through the cycle
How far did occupancy fall during COVID and how fast did it recover? That is your stress case. Is the council above or below the England median, and is the gap widening?
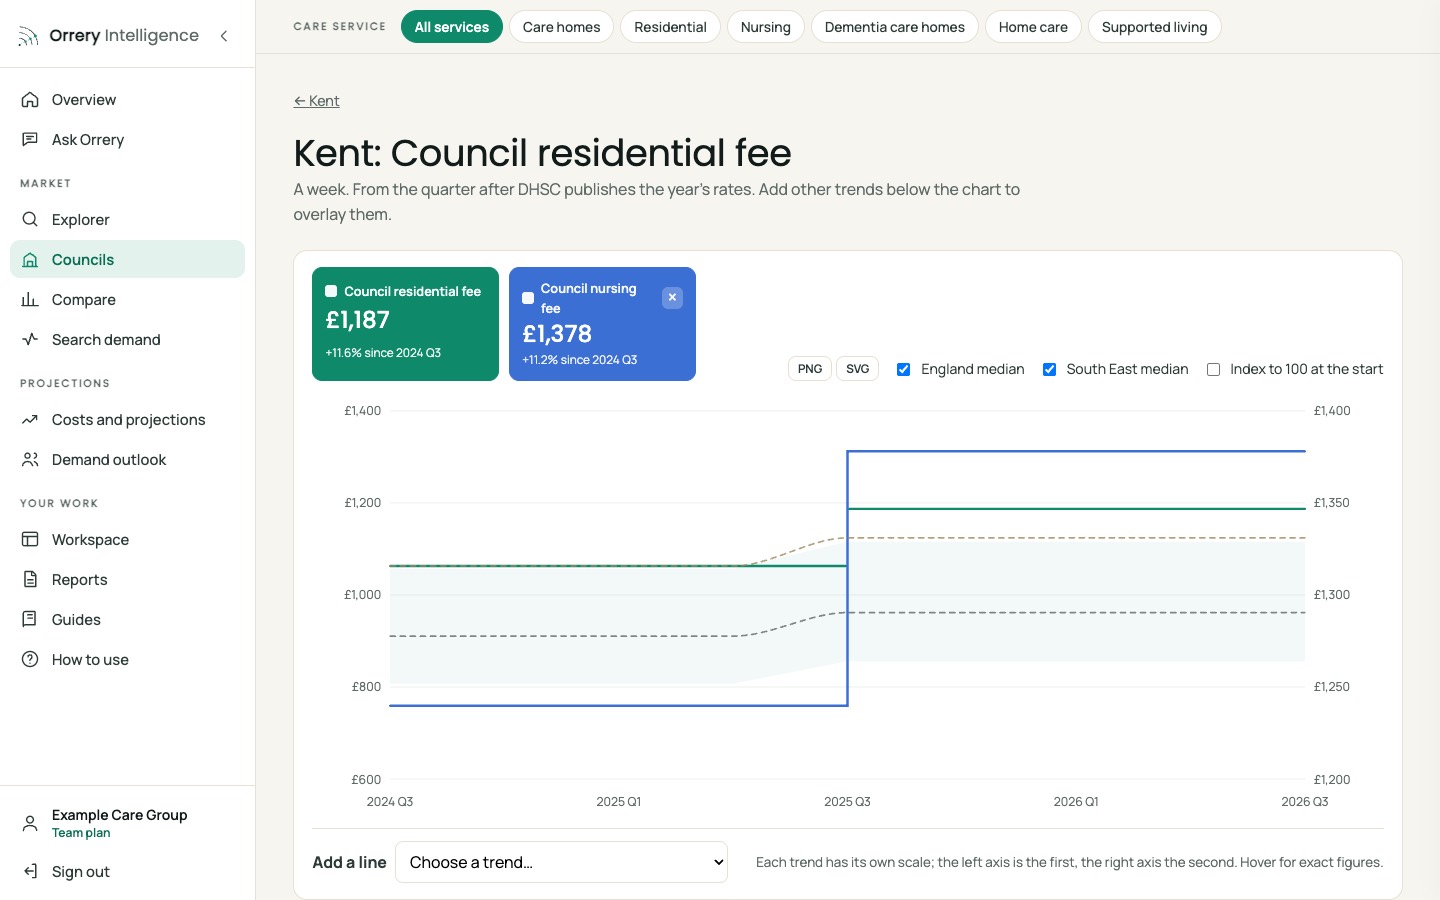
Fee record
Compare each year's rise with the National Living Wage rise (in the commentary). Rates that lag pay squeeze homes with council funded residents.
Payer mix and affordability
Self funder share and house prices: how long can self funders pay at today's fees?
Downside margin
Enter the home's beds, fees and occupancy. Press High (costs) and set fee uplifts low: does EBITDARM still cover rent or interest with headroom? Save the scenario; Team plan users can compare it with the central case.
Future demand
Over the loan term, does the district move towards shortage (supportive) or more spare capacity (riskier)?
The views you will use
Ask the data in plain English
A real question and answer from Ask Orrery, the assistant inside the platform, for a care home owner in Kent (October 2026). It answers only from Orrery's data and the subscriber's own documents, and shows its sources.
A lender would mainly worry about spare capacity in the first half of the term, and about fees not keeping up with costs. I've assumed residential and nursing homes.
- Spare beds: Kent has about 3,618 more beds than it needs today, on Orrery's central case. That falls to a shortfall of 539 by 2035, so the early loan years are the riskiest (Orrery demand model, a projection on stated assumptions, not a forecast).
- Occupancy: the 12 month average is 87.9%, against an England median of 87.7%. That leaves little headroom for a stress case (CQC and Capacity Tracker).
- Quality: 79% of homes are rated Good or better, against 84% nationally (CQC care directory).
- Fee pressure: the council residential rate is £1,187. Lenders test whether future rises keep pace with pay.
- Payer mix: 43% of residents are self funders. Orrery's model shows an average house paying for 4.2 years of care today and 3.2 by 2035.
Districts differ a lot, and home quality matters more than the market.
This is not financial advice. Take professional advice before lending.
- Lenders usually care most about the downside: the occupancy low during COVID and a year of fee rises below pay are realistic stress tests.
- A strong local market does not rescue a poorly rated home; check the rating and its date.
Answer this for your own councils
Subscribers get every guide, chart and projection for all 153 councils, Ask Orrery, and every council report.
The Orrery platform opens to subscribers shortly. Register and we will tell you first.
Register for early access