Compare your homes side by side
How do our homes compare on pay, staffing, occupancy and margin, and how much is down to each home's local market?
Upload payroll and accounts for each home. Ask Orrery compares them per resident and per bed, and sets each against its own council's market.
When people use it: Monthly or quarterly, for groups with more than one home or branch.
How it works, step by step
Upload each home's files
Name files by home so Ask Orrery can tell them apart.
Side by side
Compare per resident: homes differ in size and type.
Each home's market
District need and occupancy for each home.
What you upload
- Payroll for each home
- Accounts for each home
Files are stored privately for your account, never shared with anyone and never used to train AI. You can delete them at any time. Spreadsheets, CSV, PDF and Word files all work, in your own layout.
Try it with sample files
Made up files for a made up provider, Example Care Group, so you can see what Ask Orrery does with them.
Questions you can ask
- “Compare Example House and Example Lodge for April to September 2026: occupancy, income and staff cost per resident a week, overtime and EBITDARM margin.”
- “Example House is in Maidstone and Example Lodge in Tunbridge Wells: how do their local markets differ on occupancy, fees and demand?”
Ask the data in plain English
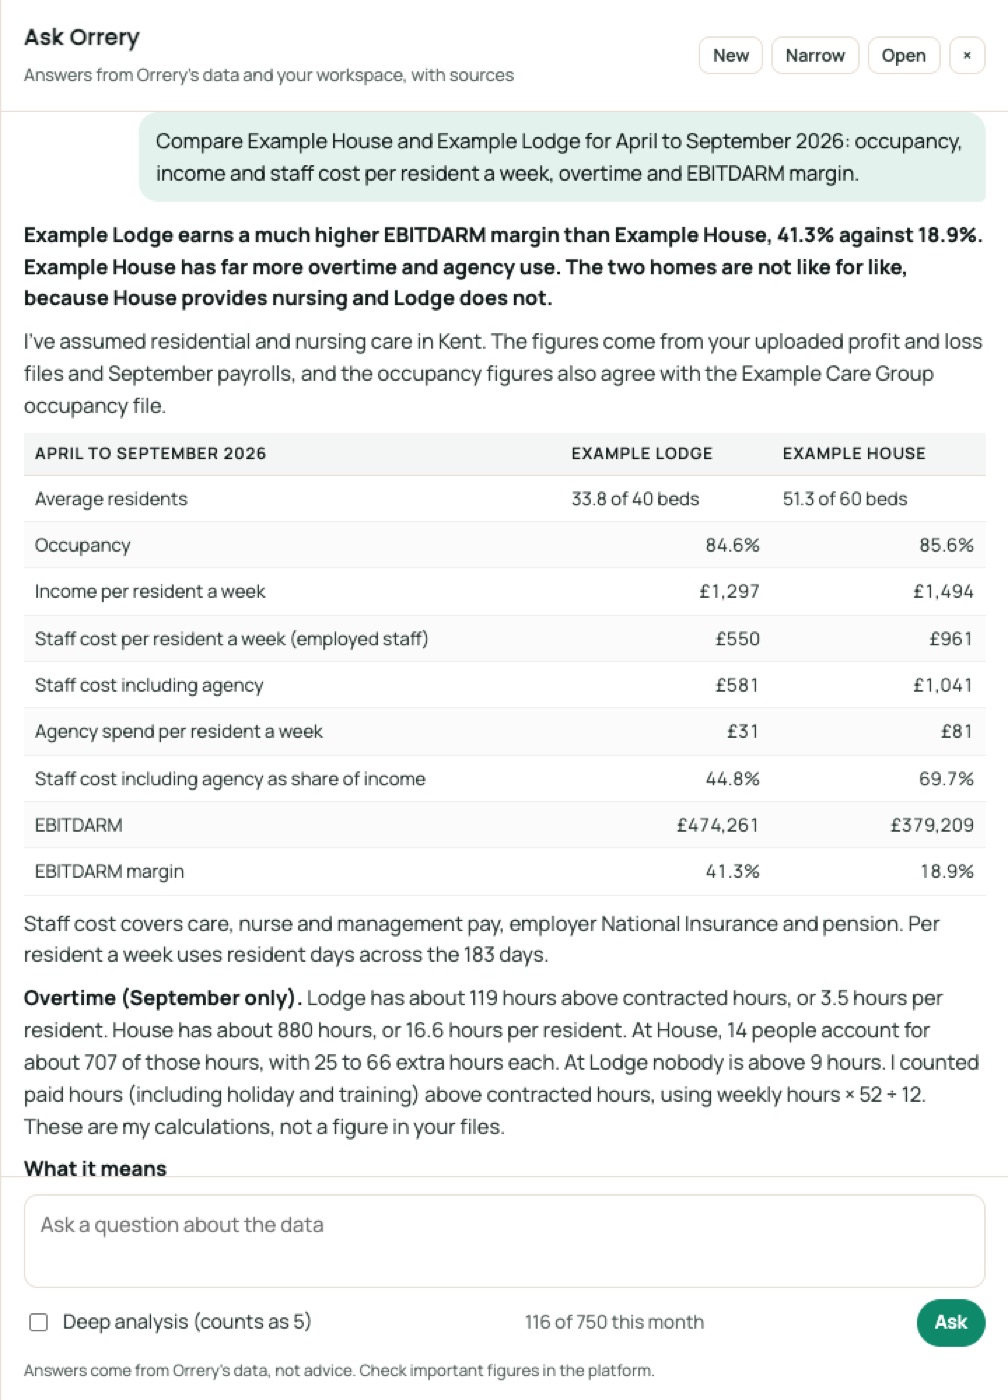
A real question and answer from Ask Orrery, the assistant inside the platform, using the Example Care Group sample files above (October 2026). It works from your files and Orrery's data, and shows its sources.
Example Lodge earns more profit per pound of income than Example House. Example House has much higher staff costs and far more overtime. Part of that is because House provides nursing care and Lodge does not.
April to September 2026
| Measure | Example House | Example Lodge |
|---|---|---|
| Average occupancy (60 and 40 beds) | 85.6% (51.3 residents) | 84.6% (33.8 residents) |
| Income per resident a week | £1,494 | £1,297 |
| Staff cost per resident a week | £1,041 | £581 |
| Staff cost as a share of income | 69.7% | 44.8% |
| Agency per resident a week (included in staff cost) | £81 | £31 |
| EBITDARM | £379,210 | £474,261 |
| EBITDARM margin | 18.9% | 41.3% |
| Overtime, September only | about 880 hours | about 119 hours |
Where the figures come from
- Occupancy, income, costs and EBITDARM come from each home's profit and loss file.
- Staff cost is care, nurse and management pay, employer National Insurance, employer pension and agency.
- Weekly figures use resident days, which are average residents multiplied by days in each month.
Overtime
- I counted paid hours above contracted hours, using weekly hours × 52 ÷ 12.
- Holiday and training hours count as paid. Salaried managers and agency staff are excluded.
- Lodge only has a September payroll, so I could only compare September.
- In September about 53 of House's 79 hourly staff went over contract. That is about 17 hours per resident.
- At Lodge it was about 23 of 36 staff, or about 3.5 hours per resident.
What it means
- House has a nursing mix, which Lodge does not, so a gap in staff cost is expected.
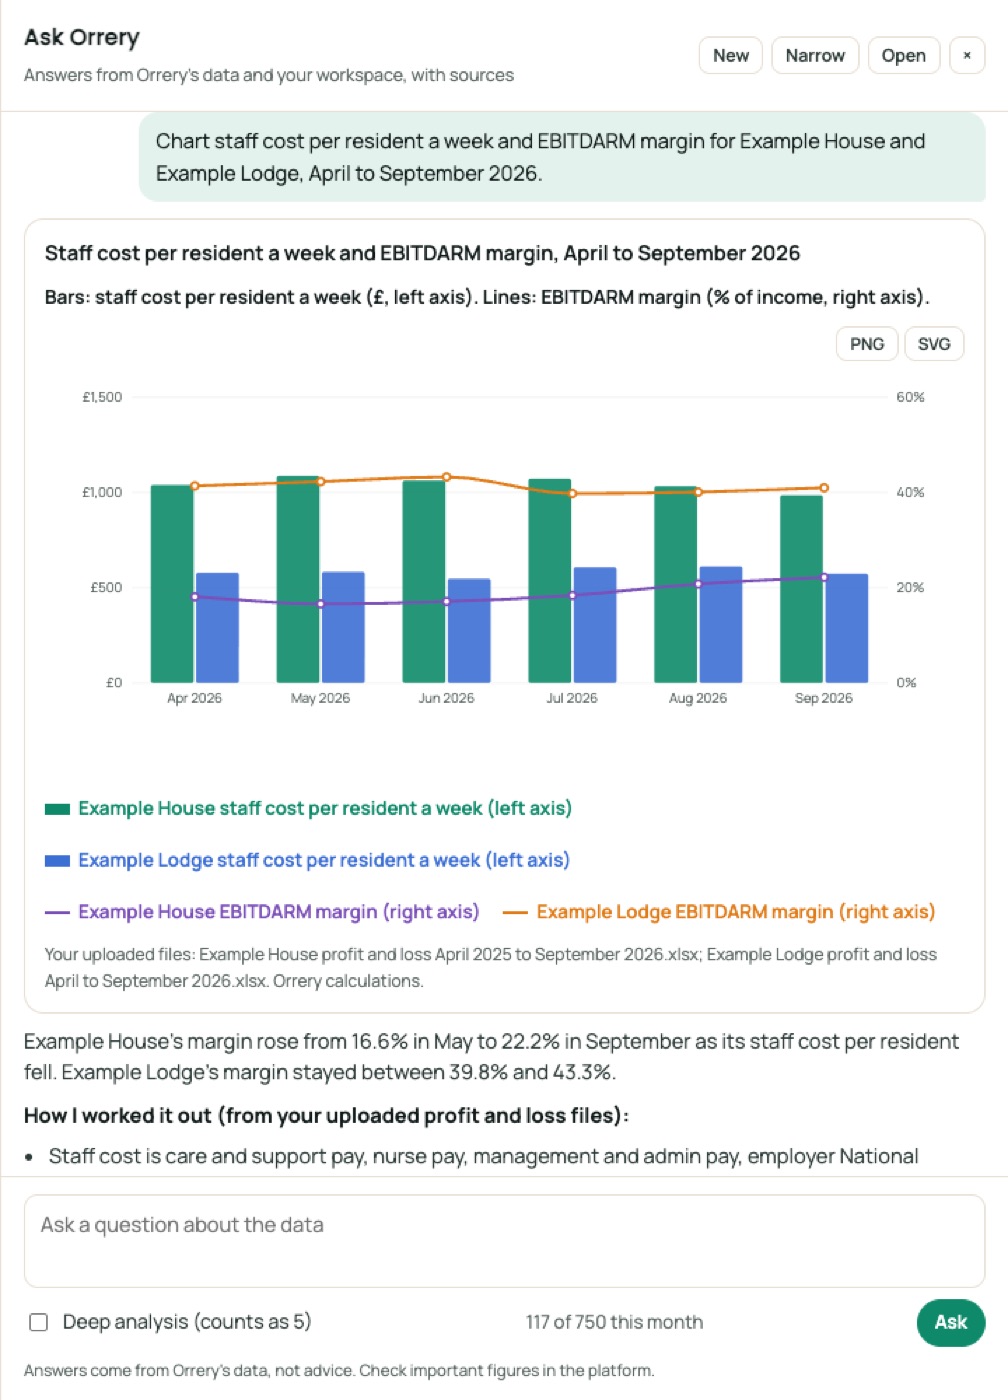
- House's margin has improved, from 18.1% in April to 22.2% in September.
- Its agency spend rose over the same months, from £16,480 in April to £19,337 in September, having peaked at £21,588 in August. Heavy overtime alongside agency use often points to unfilled posts.
- Lodge's margin stayed between about 40% and 42% (lowest in July, at 39.8%).
Open in Orrery: /app/guides/overtime-report?council=england
Ask, chart and report, in plain English
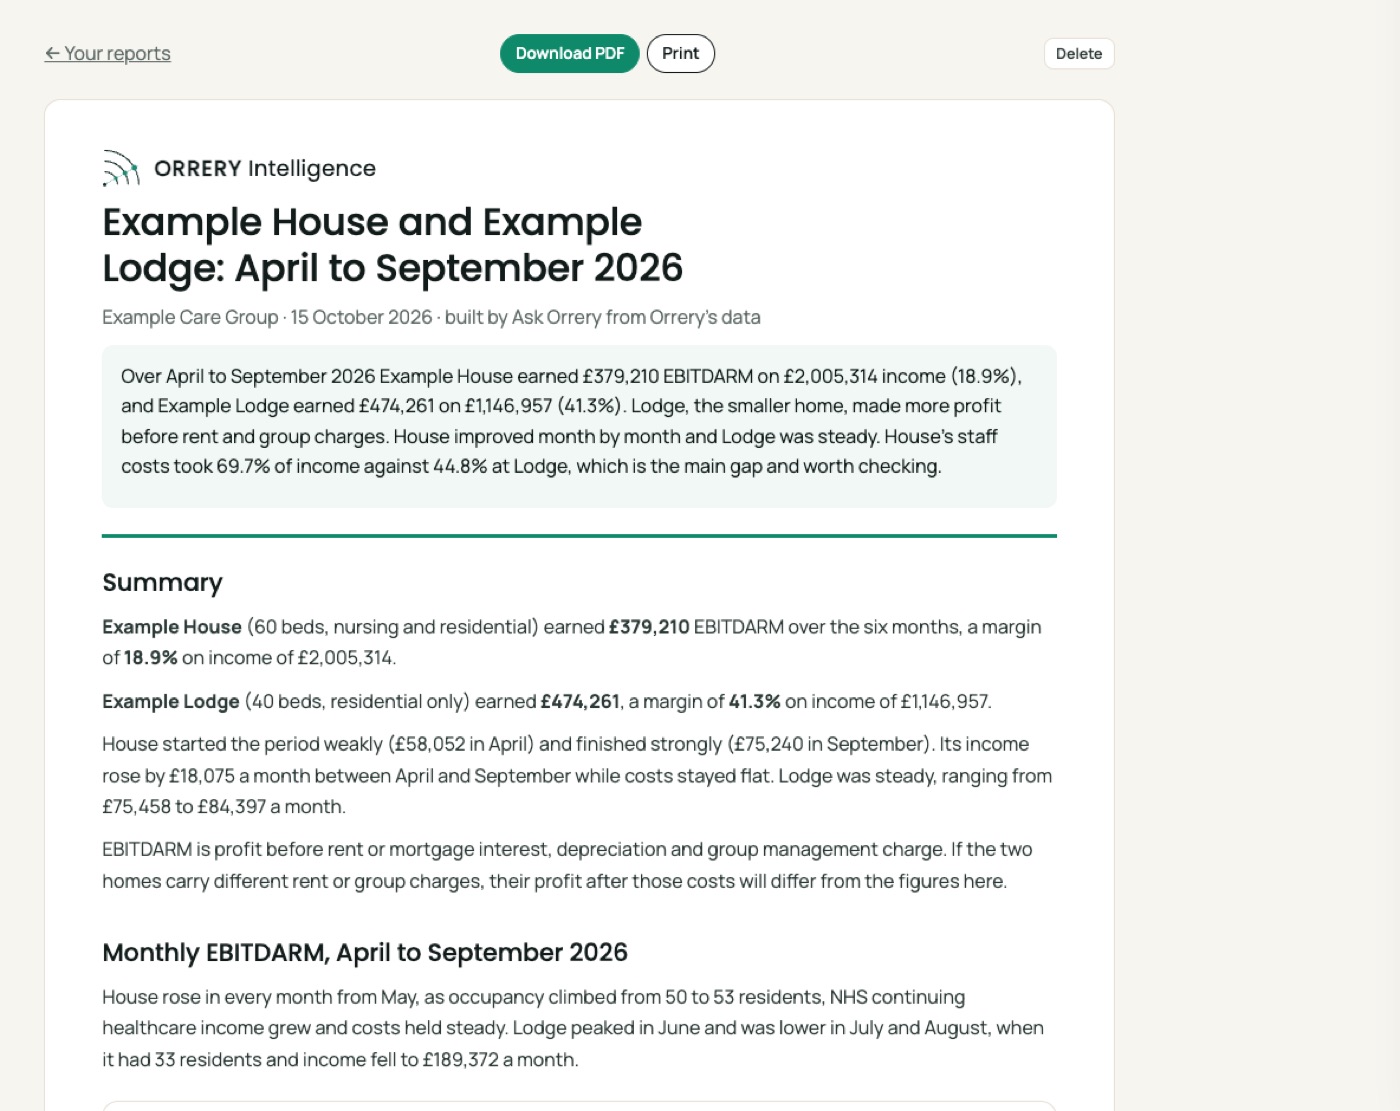
Ask Orrery answers from Orrery's data and your own files, draws charts on request and builds reports you can save as PDF. These are real examples made with the sample files.
- A home behind on margin in a strong market has a fixable problem; in a weak market it may not.
Answer this with your own files
Subscribers get every guide, chart and projection for all 153 councils, Ask Orrery with private uploads of their own files, and every council report.
The Orrery platform opens to subscribers shortly. Register and we will tell you first.
Register for early access