Modelling fee rises across your residents
What does each fee rise option bring in across our residents by who pays, and how do our fees compare with the market?
Upload your list of residents and fees (no names needed). Ask Orrery models fee rise options by payer, shows extra income a year, flags residents paying well below current fees, and compares with council rates and local private fees.
When people use it: January to March, before fee rise letters go out.
How it works, step by step
Upload the list
Leave names out: room numbers are enough.
Model the options
Long stay residents on old fees are often where the biggest gap is.
What the council pays
Council rates set the floor; local private fees set the ceiling families compare against.
What families can afford
House prices against a year of fees.
What you upload
- A list of rooms or residents with care type, who pays and the weekly fee (no names needed)
Files are stored privately for your account, never shared with anyone and never used to train AI. You can delete them at any time. Spreadsheets, CSV, PDF and Word files all work, in your own layout.
Try it with sample files
Made up files for a made up provider, Example Care Group, so you can see what Ask Orrery does with them.
Questions you can ask
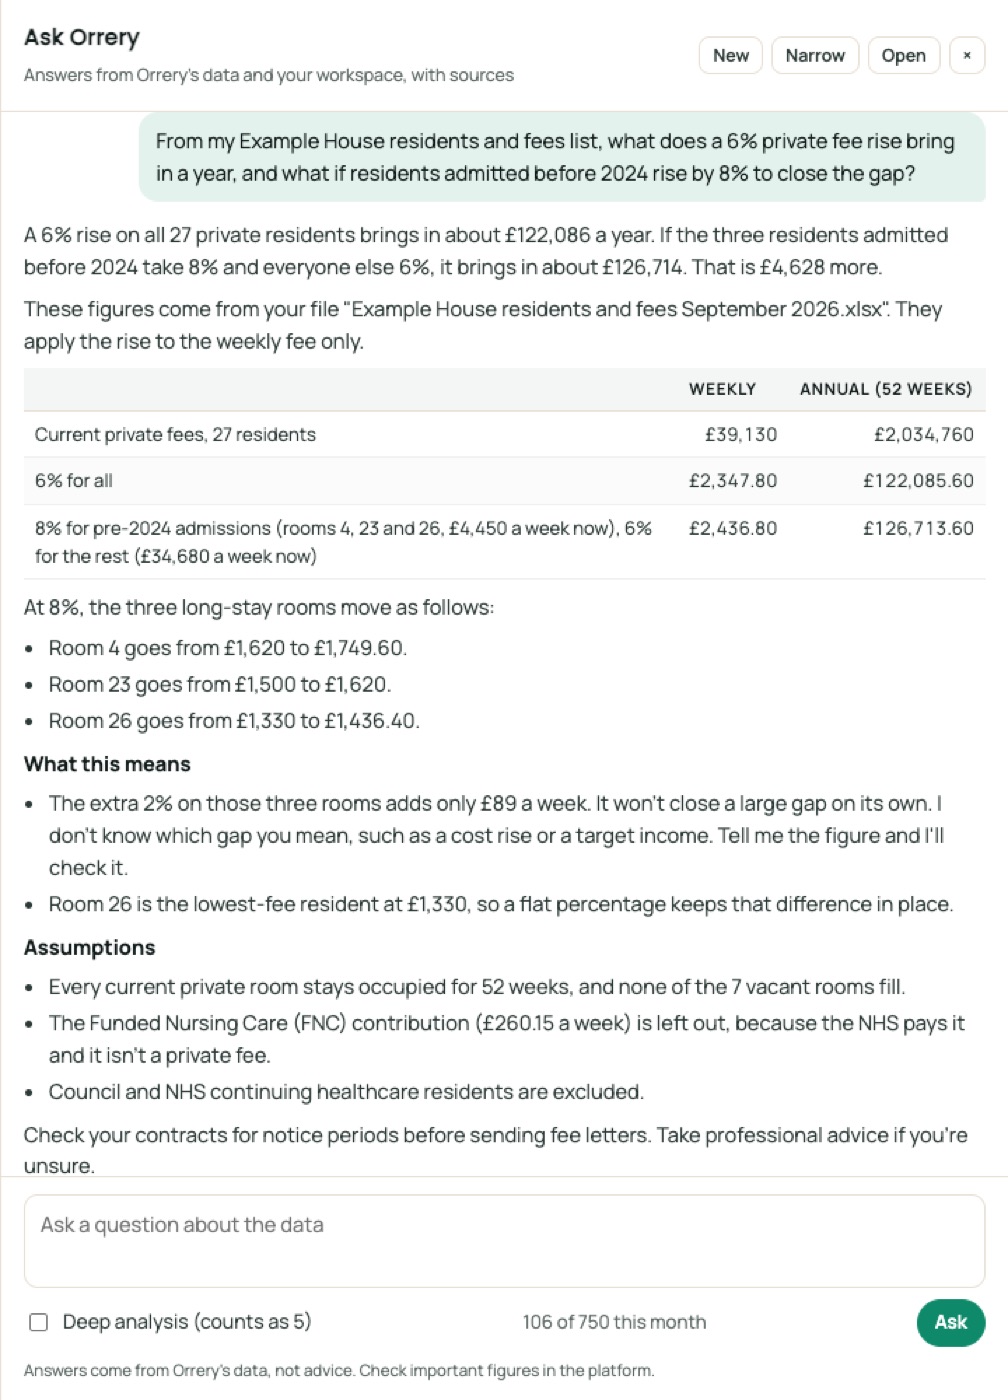
- “From my Example House residents and fees list, what does a 6% private fee rise bring in a year, and what if residents admitted before 2024 rise by 8% to close the gap?”
- “How do my fees compare with Kent's council rates and local private fees?”
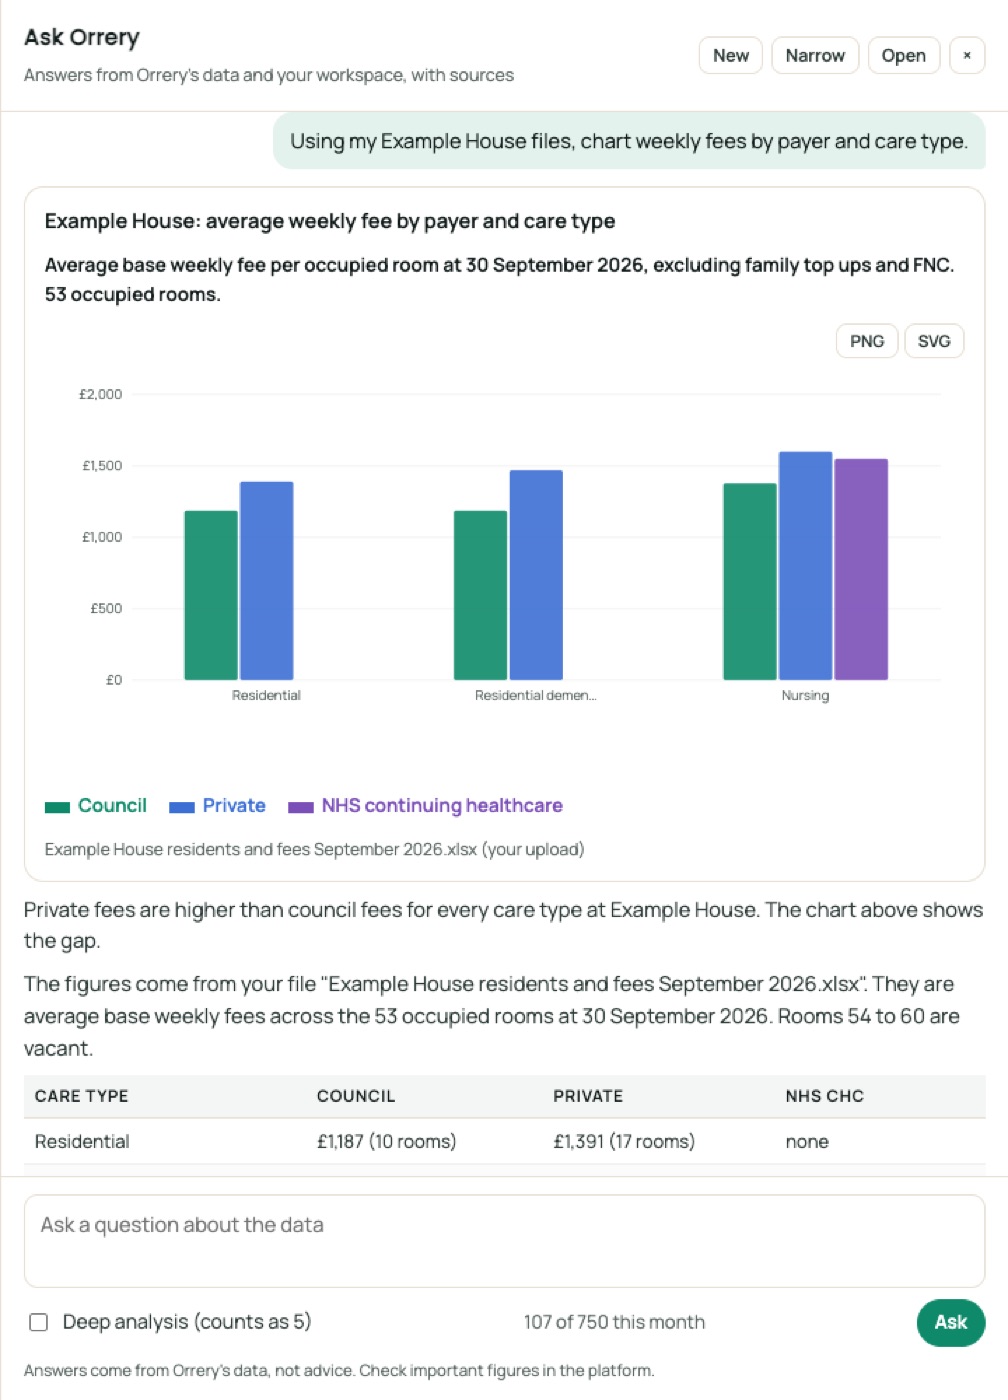
- “Chart weekly fees by payer and care type.”
Ask the data in plain English
A real question and answer from Ask Orrery, the assistant inside the platform, using the Example Care Group sample files above (October 2026). It works from your files and Orrery's data, and shows its sources.
A flat 6% rise on your private payers brings in about £122,086 a year. Raising the three residents admitted before 2024 by 8% instead takes that to about £126,714, which is £4,628 more.
Source: your "Example House residents and fees September 2026" file. I did the sums myself from its rows.
6% on all private payers
- There are 27 private rooms, paying £39,130 a week in total.
- 6% adds £2,347.80 a week, or £122,085.60 over 52 weeks.
8% for residents admitted before 2024, 6% for the rest
| Room | Care type | Weekly fee | Admitted | Fee at 8% |
|---|---|---|---|---|
| 4 | Nursing | £1,620 | 2022-05-13 | £1,749.60 |
| 23 | Nursing | £1,500 | 2023-07-25 | £1,620.00 |
| 26 | Residential | £1,330 | 2023-10-02 | £1,436.40 |
- These three pay £4,450 a week. The other 24 pay £34,680.
- The weekly gain is £2,436.80, so £126,713.60 a year.
How to read it
- Room 4 already pays the same as newer nursing residents (£1,620), so the long-stay gap is really rooms 23 and 26. At 8%, room 23 reaches £1,620, which is today's nursing rate.
- I don't know what "the gap" means in your question. If you have a target figure, such as a cost rise, tell me and I'll work out what is needed.
Assumptions
- I applied the rise to the weekly fee only, not to FNC.
- I assumed the same 27 residents, no leavers and no empty rooms for 52 weeks.
- I left out council-funded rooms and the one NHS continuing healthcare room.
- I made no allowance for notice periods or residents who leave after a rise. Check your contracts.
Our fee rise guide has more on this: /app/guides/fee-rise-model?council=kent
Ask, chart and report, in plain English
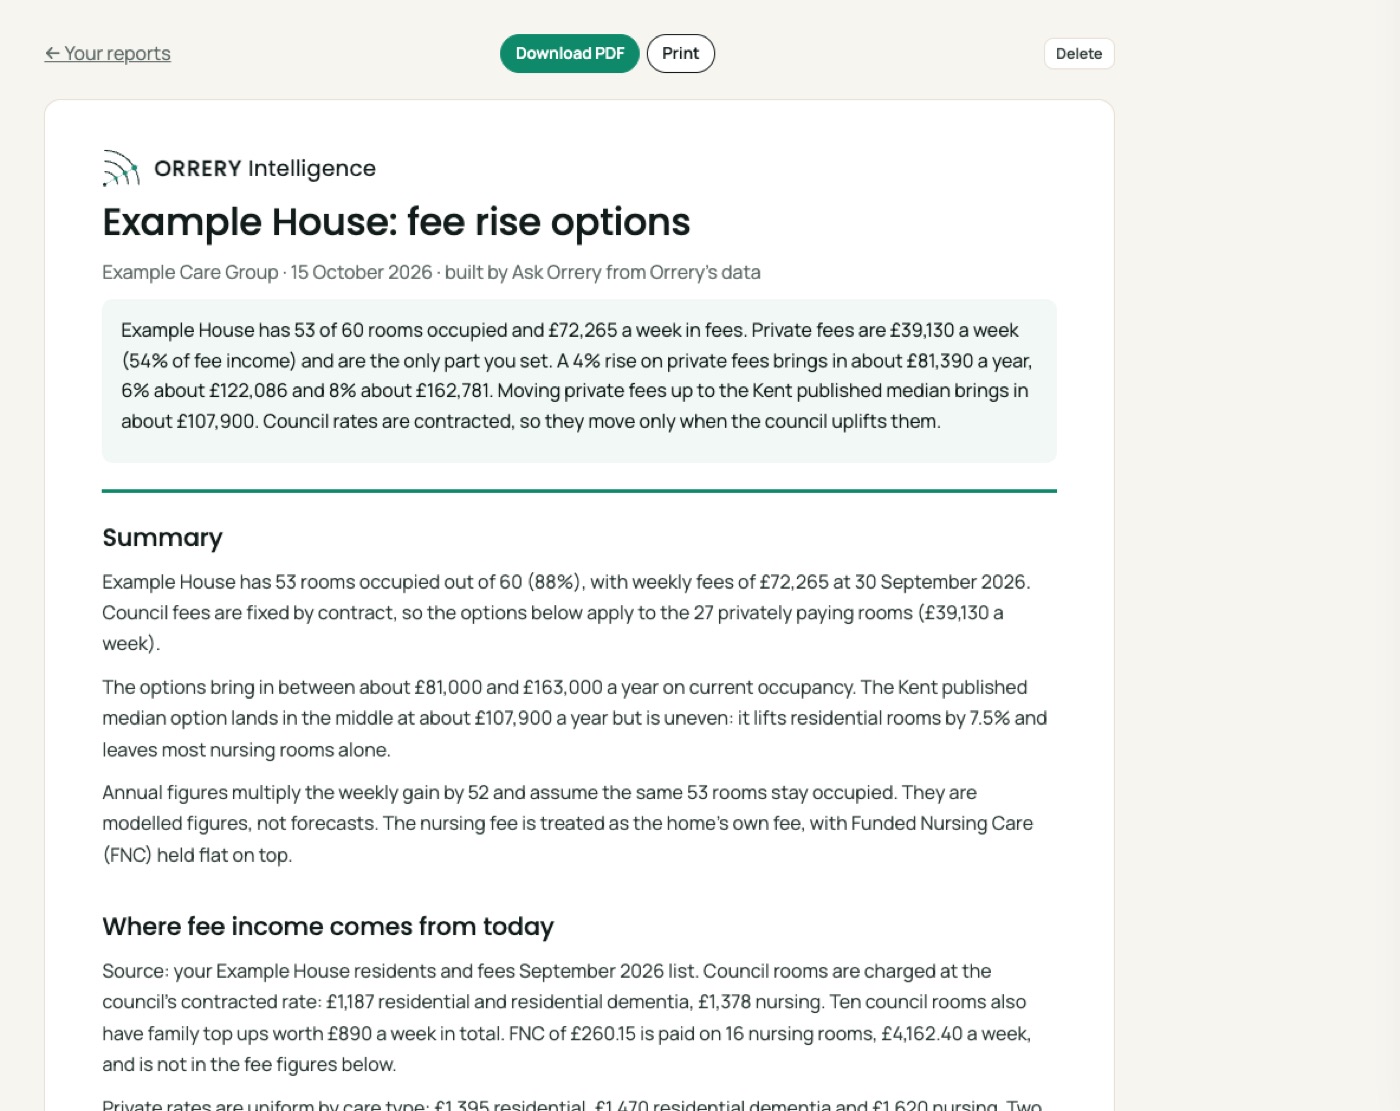
Ask Orrery answers from Orrery's data and your own files, draws charts on request and builds reports you can save as PDF. These are real examples made with the sample files.
- Check each option against your cost rise first (see the pay rise scenario).
- Fee letters need notice under most contracts; check yours.
Answer this with your own files
Subscribers get every guide, chart and projection for all 153 councils, Ask Orrery with private uploads of their own files, and every council report.
The Orrery platform opens to subscribers shortly. Register and we will tell you first.
Register for early access