Your monthly market check
What has changed in my market this month, and does any of it need action?
Five figures, in ten minutes: supply, occupancy, competition, house prices and what new data is due.
When people use it: Once a month, and whenever the weekly data refresh shows a change in a council you follow.
How it works, step by step
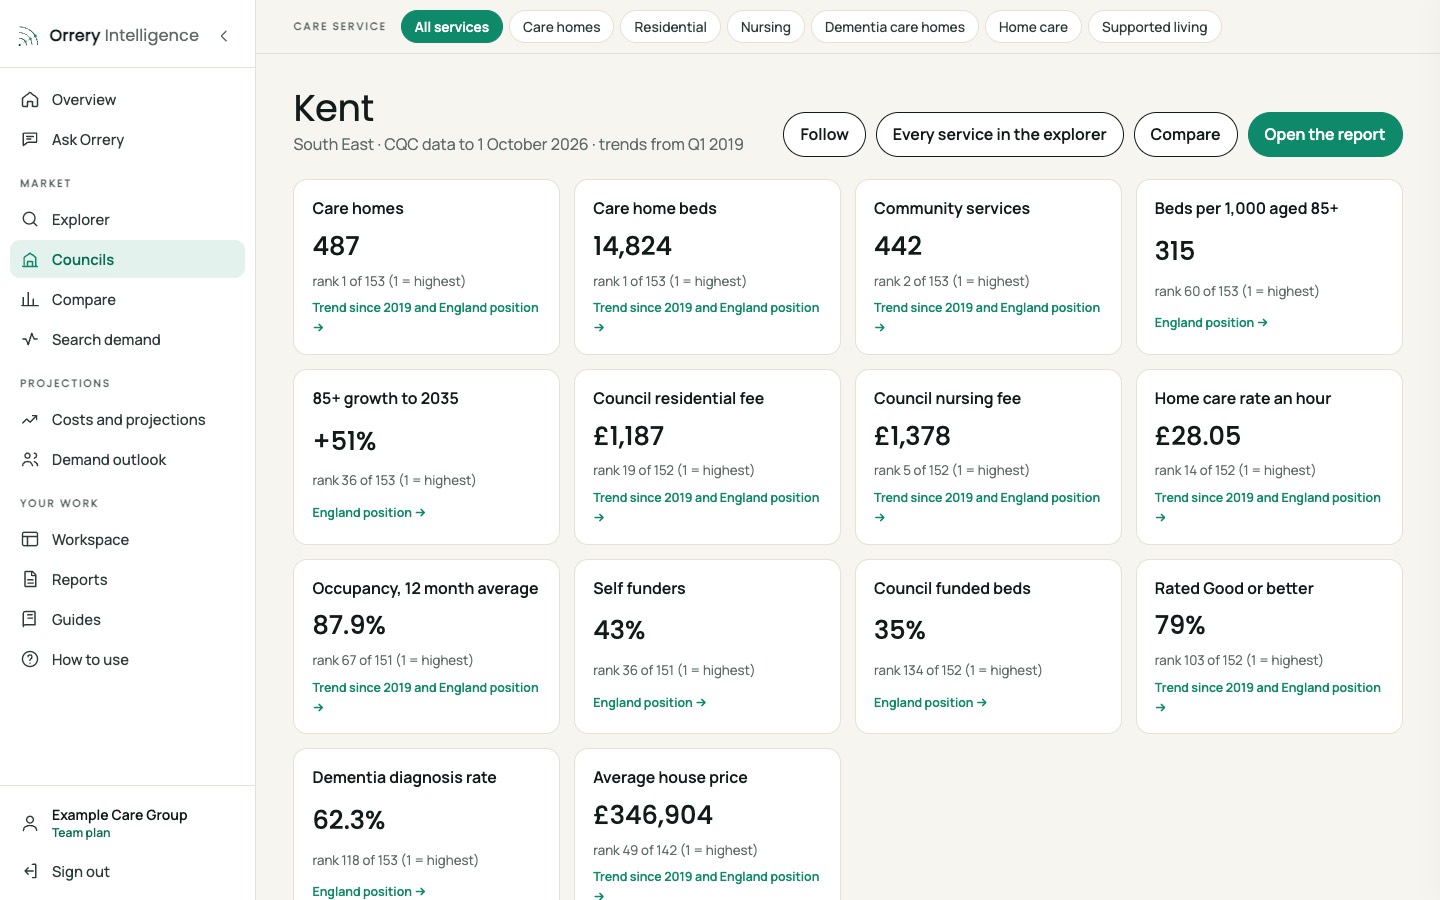
The council at a glance
Scan the boxes: each one shows its rank; open any that moved.
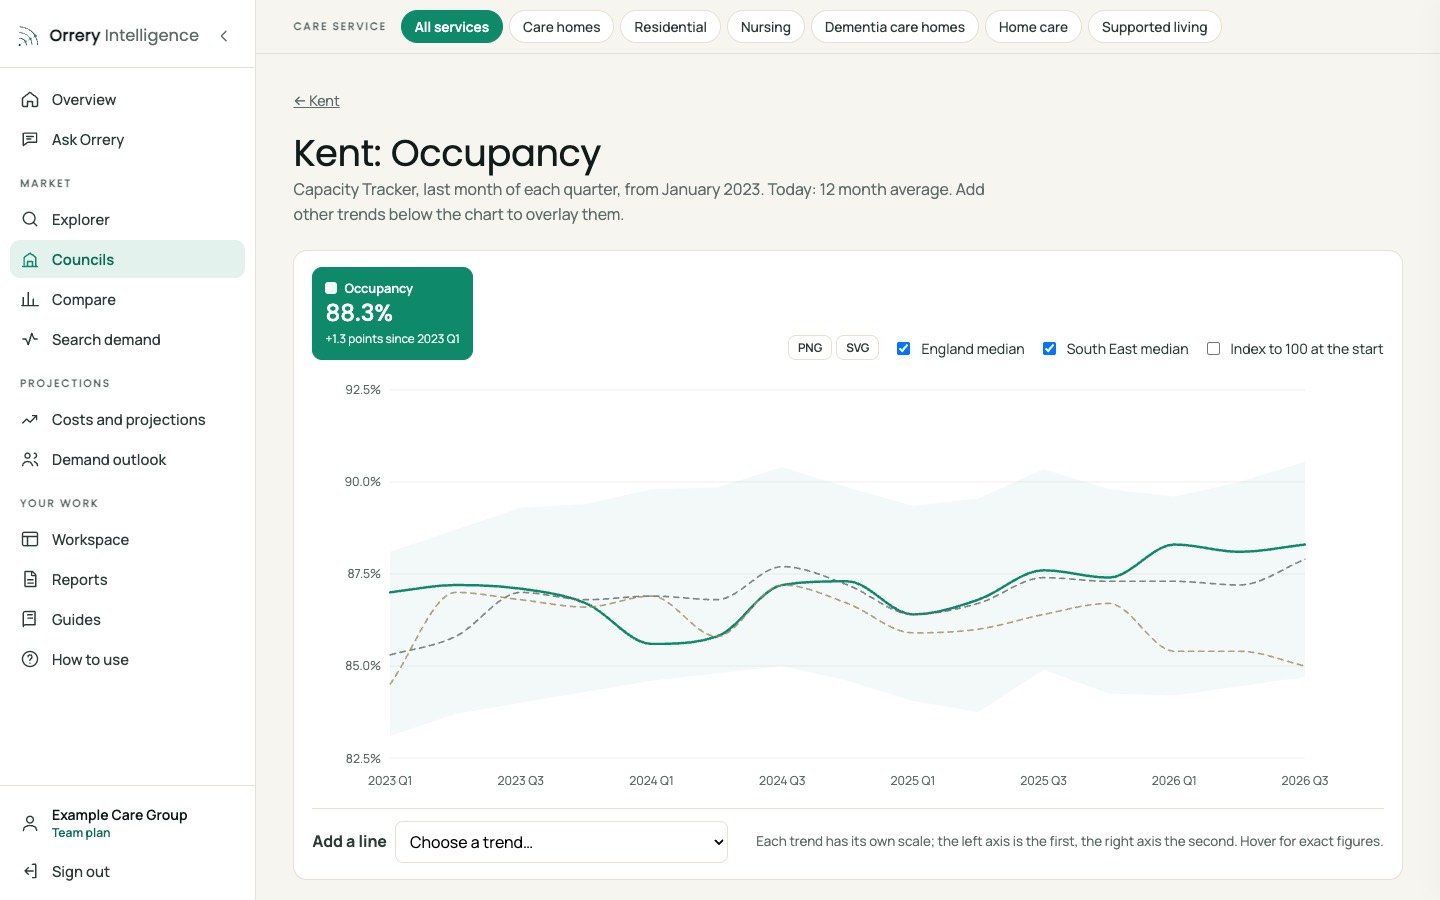
Occupancy
A fall of more than a point on a year earlier is worth a closer look.
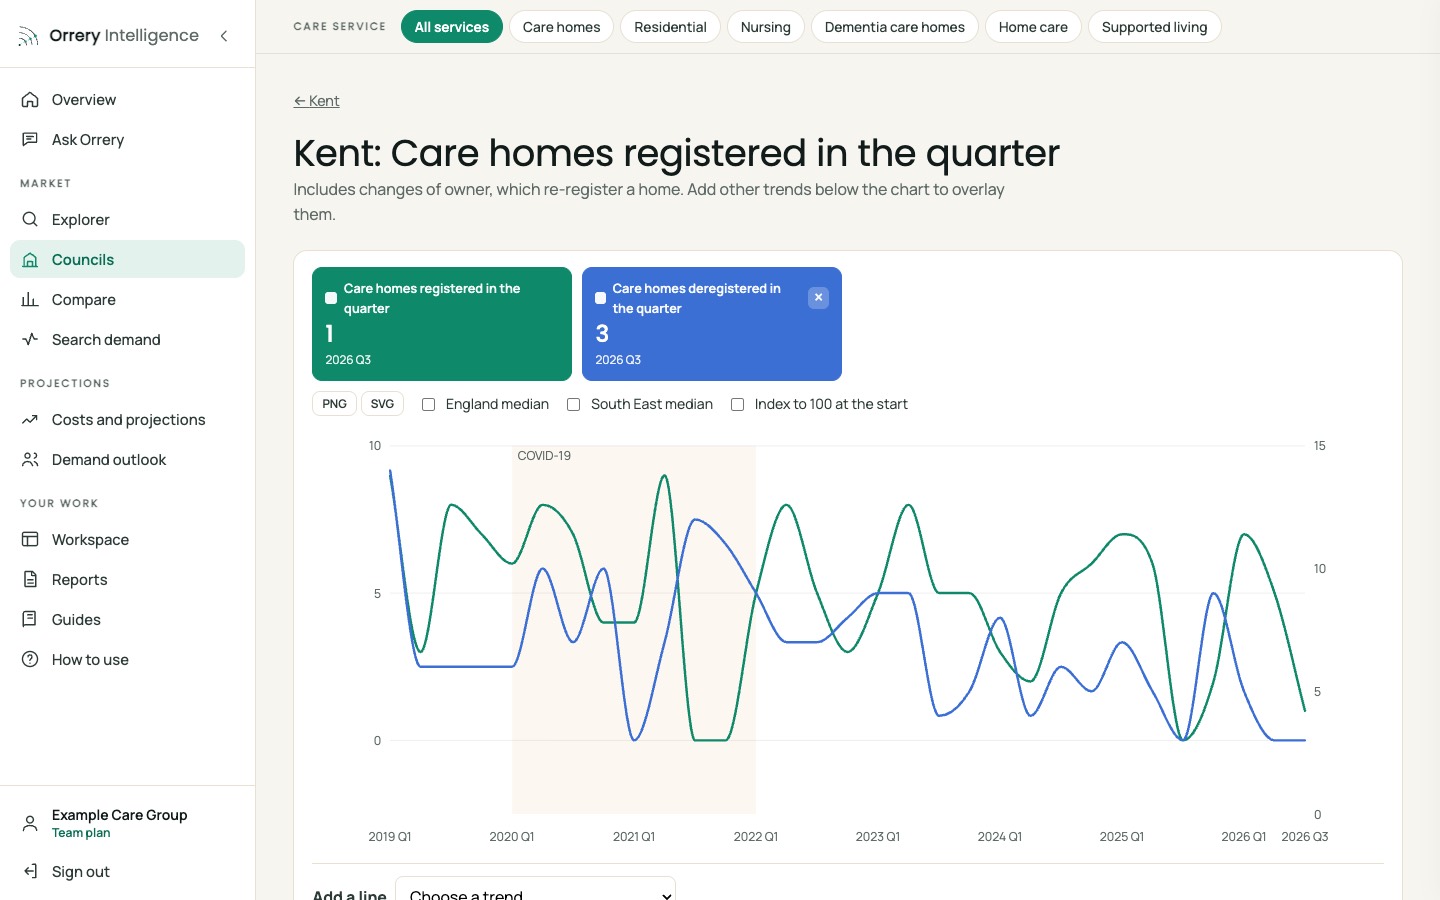
New and closed homes
A new registration near you is a new competitor or a change of owner: check it in the explorer.
Your workspace
Follow every council you work in so they are one click away.
The views you will use
Ask the data in plain English
A real question and answer from Ask Orrery, the assistant inside the platform, for a care home owner in Kent (October 2026). It answers only from Orrery's data and the subscriber's own documents, and shows its sources.
Kent care homes: the last year (to 2026 Q3)
Kent has fewer homes but slightly more beds, and the market has tightened a little.
- Homes: 487, down 1.0% from 492 a year ago (CQC care directory).
- Beds: 14,824, up 1.3% from 14,638. The average home is getting larger.
- Occupancy: 88.3%, up 0.7 points from 87.6% (Capacity Tracker). That is healthy, but not very tight.
- Council residential fee: £1,187 a week. The rise of 11.6% came in 2025 Q3, which is the start of this period, and the rate has not changed since (DHSC MSIF returns). England's median is £962.
These are historical figures, not forecasts.
- Most months nothing needs action; the value is spotting the month that does, early.
Answer this for your own councils
Subscribers get every guide, chart and projection for all 153 councils, Ask Orrery, and every council report.
The Orrery platform opens to subscribers shortly. Register and we will tell you first.
Register for early access