Enquiries and admissions: what converts
Where do our enquiries come from, which turn into admissions, and how does that match when families search?
Upload your enquiry log. Ask Orrery shows enquiries and admissions by source and month, conversion rates and reasons lost, and sets them against search demand and the cost of a click in your area.
When people use it: Monthly, and before marketing budgets are set.
How it works, step by step
Upload the log
Any spreadsheet with one row per enquiry works.
What converts
Viewings are the step to watch: most admissions follow a viewing.
When families search
Search demand by month and district, and the cost of a click.
What you upload
- Your enquiry log (date, source, care type, outcome)
Files are stored privately for your account, never shared with anyone and never used to train AI. You can delete them at any time. Spreadsheets, CSV, PDF and Word files all work, in your own layout.
Try it with sample files
Made up files for a made up provider, Example Care Group, so you can see what Ask Orrery does with them.
Questions you can ask
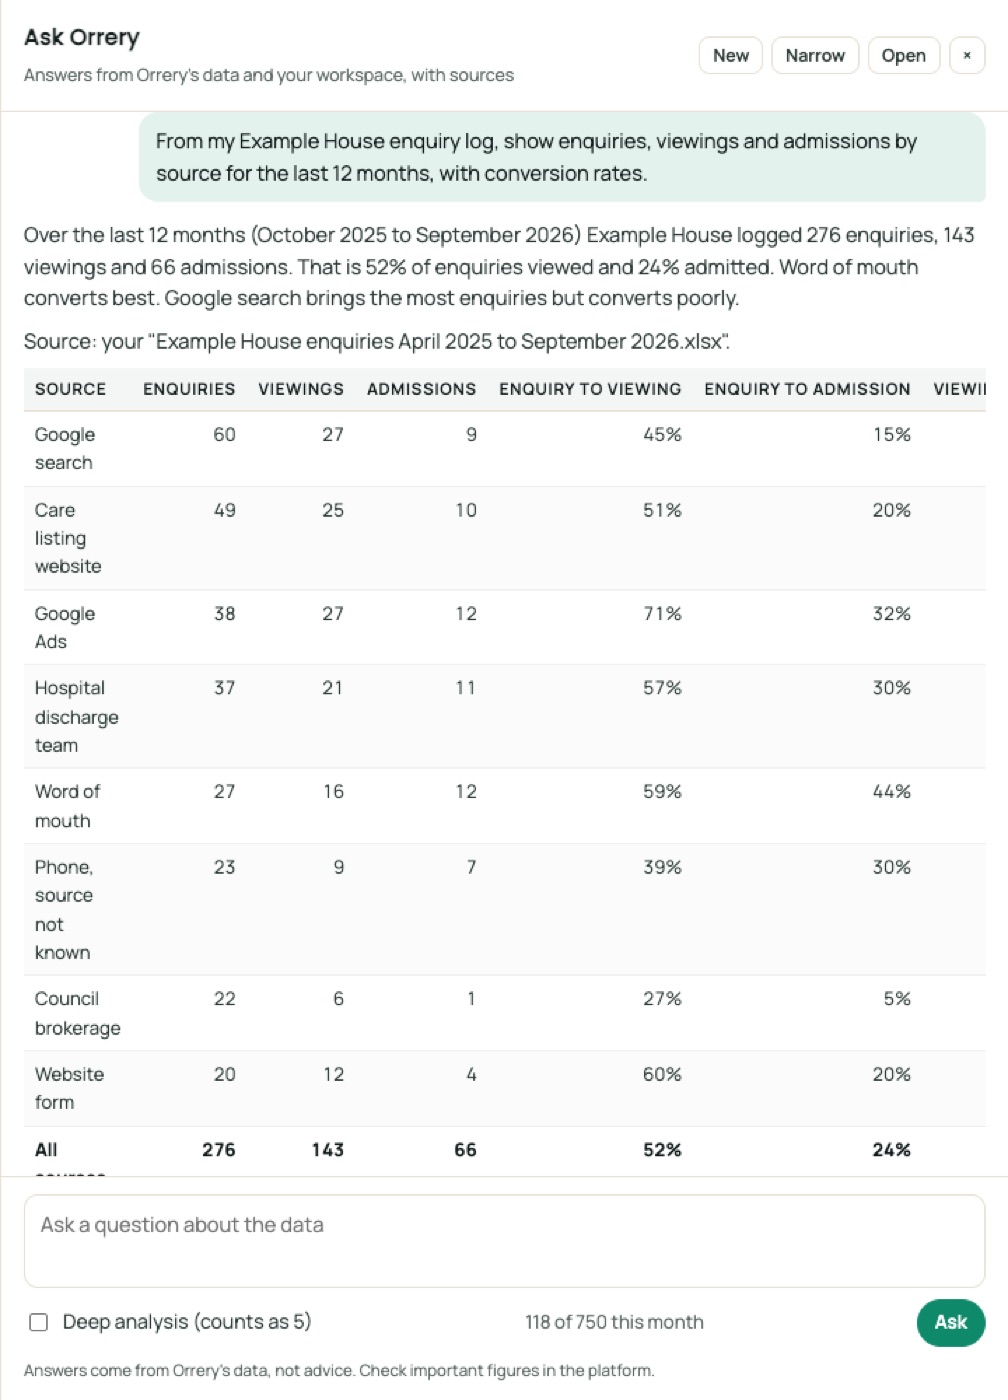
- “From my Example House enquiry log, show enquiries, viewings and admissions by source for the last 12 months, with conversion rates.”
- “What are the main reasons we lose enquiries, and how many were lost on fee?”
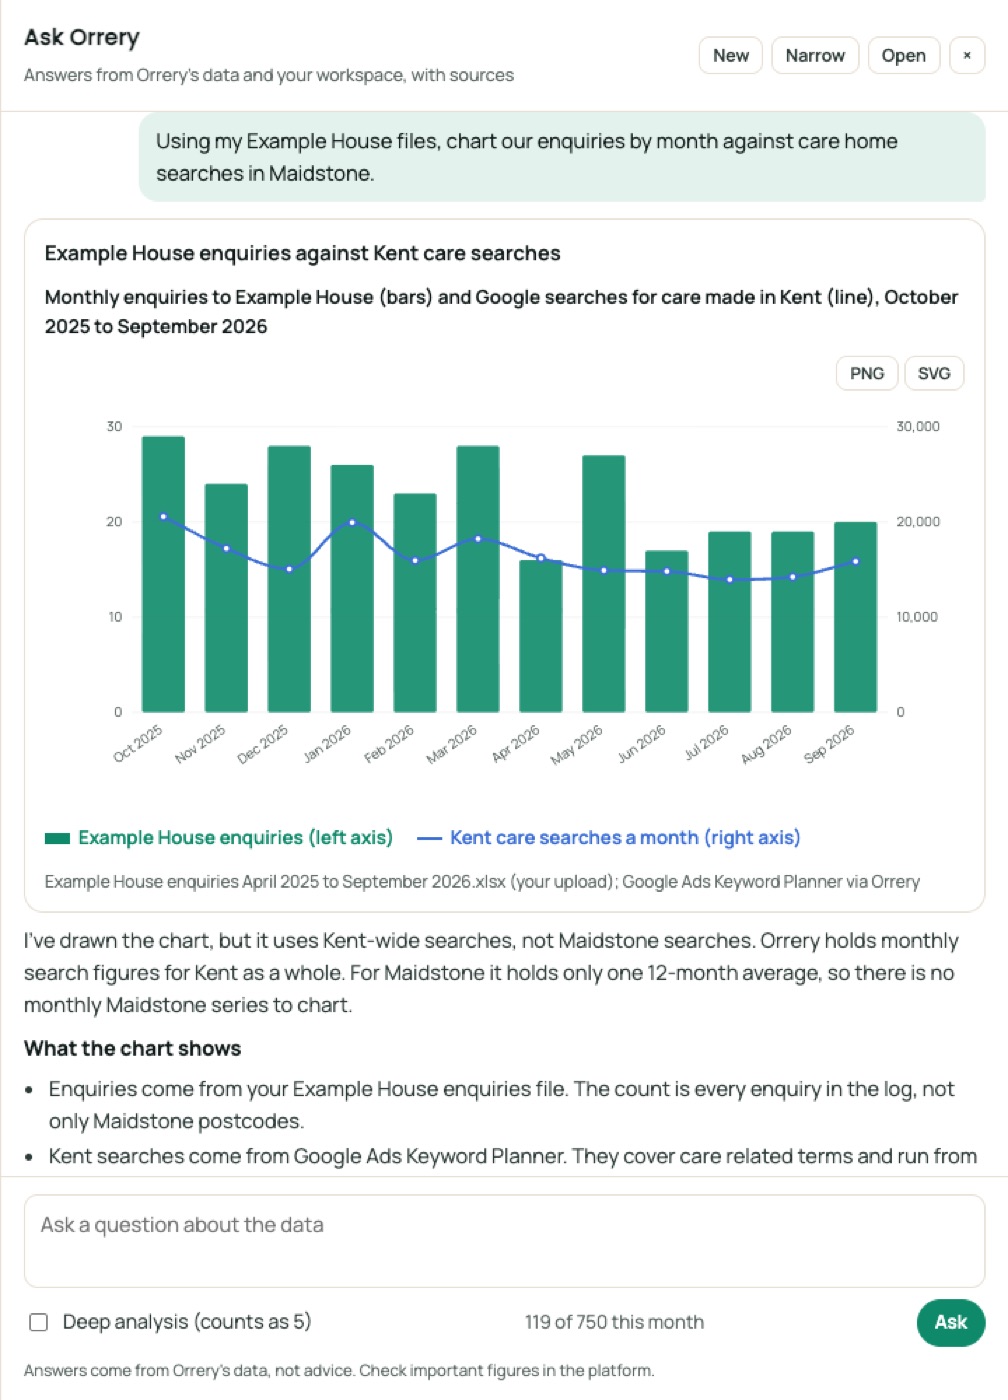
- “Chart our enquiries by month against care home searches in Maidstone.”
Ask the data in plain English
A real question and answer from Ask Orrery, the assistant inside the platform, using the Example Care Group sample files above (October 2026). It works from your files and Orrery's data, and shows its sources.
Over the last 12 months of the log (October 2025 to September 2026), Example House had 276 enquiries, 143 viewings and 66 admissions. That is 51.8% of enquiries viewing and 23.9% admitted. Word of mouth converts best and Google search converts worst among the larger sources.
Source: your Example House enquiries April 2025 to September 2026.xlsx, which I counted by source.
| Source | Enquiries | Viewings | Admissions | Viewed % | Admitted % of enquiries | Admitted after viewing, % of viewings |
|---|---|---|---|---|---|---|
| Google search | 60 | 27 | 9 | 45.0% | 15.0% | 22.2% |
| Care listing website | 49 | 25 | 10 | 51.0% | 20.4% | 32.0% |
| Google Ads | 38 | 27 | 12 | 71.1% | 31.6% | 44.4% |
| Hospital discharge team | 37 | 21 | 11 | 56.8% | 29.7% | 47.6% |
| Word of mouth | 27 | 16 | 12 | 59.3% | 44.4% | 62.5% |
| Phone, source not known | 23 | 9 | 7 | 39.1% | 30.4% | 55.6% |
| Council brokerage | 22 | 6 | 1 | 27.3% | 4.5% | 16.7% |
| Website form | 20 | 12 | 4 | 60.0% | 20.0% | 25.0% |
| All sources | 276 | 143 | 66 | 51.8% | 23.9% | 38.5% |
What stands out
- Word of mouth: it has only 27 enquiries but 12 admissions, the best conversion.
- Google search: it brings the most enquiries but only 15.0% are admitted.
- Google Ads: it gets more people to view (71.1%) and converts them better than Google search does.
- Council brokerage: it produces few viewings and one admission.
How to read this
- Eleven admissions had no viewing logged, so I counted them as admissions but not as admitted after viewing. That is why the last column totals 55, not 66.
- Several sources have fewer than 40 enquiries. A change of one or two admissions moves their rates a lot, so treat them as indications.
- I counted admissions by the outcome recorded, not by admission date.
- Your log ends in September 2026, so October 2026 is not included.
Orrery has an "Enquiries and admissions: what converts" guide that goes further. I can also chart these rates or break them down by care type or funding.
Ask, chart and report, in plain English
Ask Orrery answers from Orrery's data and your own files, draws charts on request and builds reports you can save as PDF. These are real examples made with the sample files.
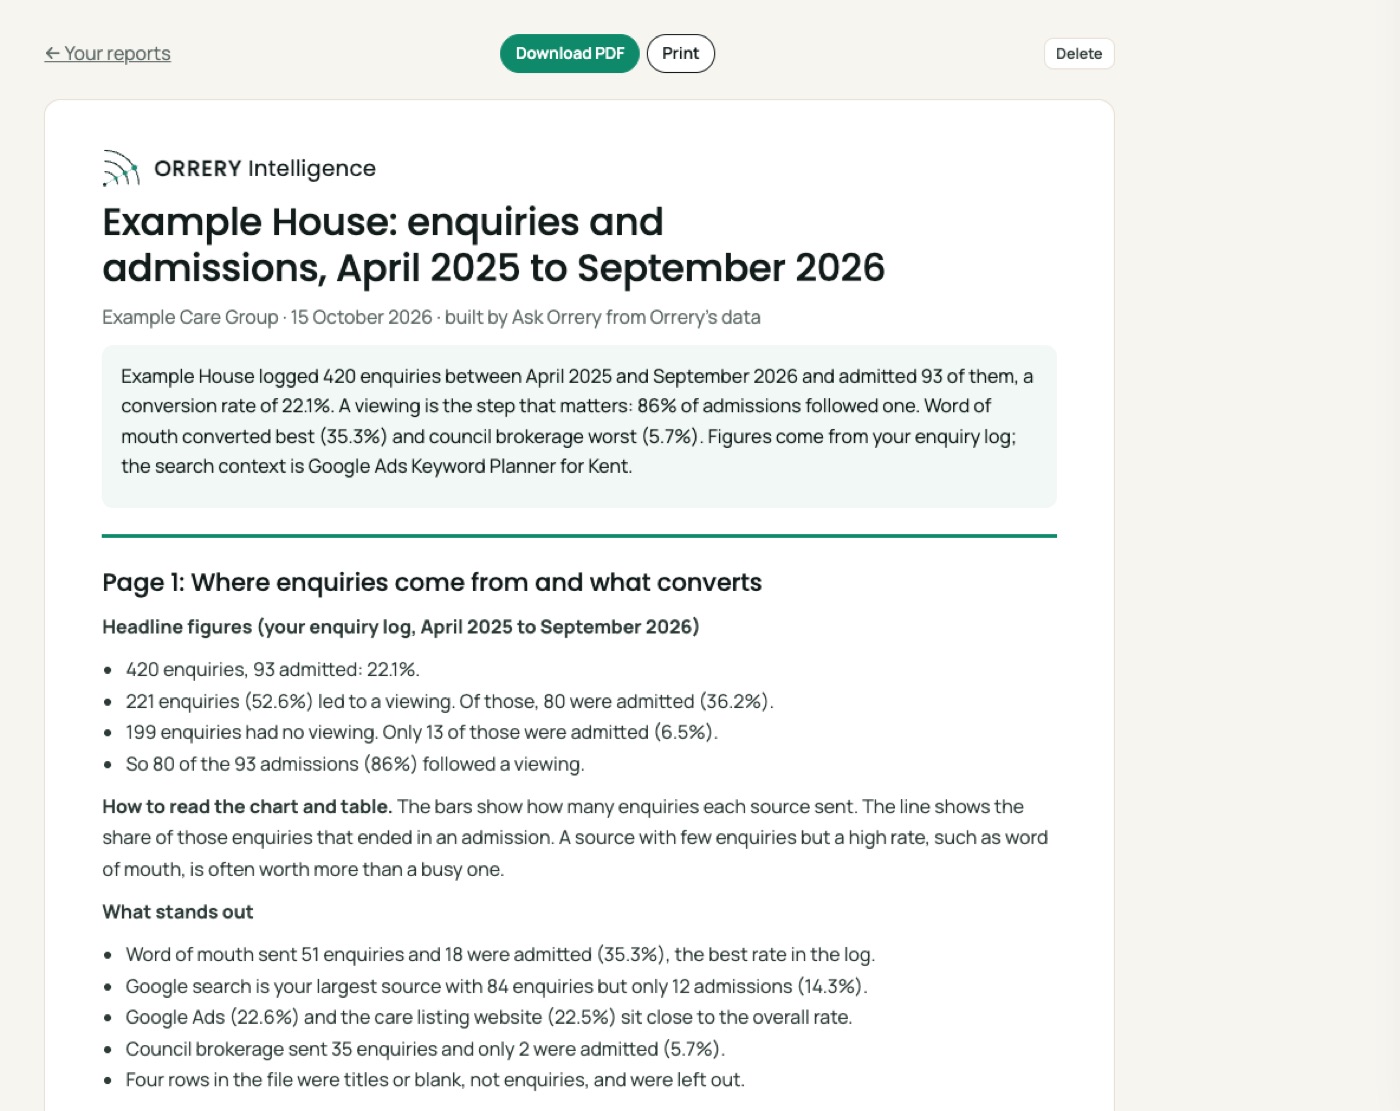
- A source with few enquiries but high conversion is often worth more than a busy one.
- Enquiries lost on fee are a pricing signal; enquiries lost for no room are a capacity signal.
Answer this with your own files
Subscribers get every guide, chart and projection for all 153 councils, Ask Orrery with private uploads of their own files, and every council report.
The Orrery platform opens to subscribers shortly. Register and we will tell you first.
Register for early access