Your accounts against a typical home in your council
Where do our costs per resident differ from a typical home in our area, and what is our margin against it?
Upload management accounts. Ask Orrery turns them into income and costs per resident a day and sets them against Orrery's model of a typical home in your council, line by line.
When people use it: When monthly or annual accounts are ready.
How it works, step by step
Upload the accounts
A spreadsheet export is best. Ask Orrery reads the line names and months as they are.
Per resident a day
Totals hide size; cost per resident a day makes homes comparable.
The typical home
The model Ask Orrery compares with: change beds, fees and occupancy to match your home.
What you upload
- Management accounts or a profit and loss by month
Files are stored privately for your account, never shared with anyone and never used to train AI. You can delete them at any time. Spreadsheets, CSV, PDF and Word files all work, in your own layout.
Try it with sample files
Made up files for a made up provider, Example Care Group, so you can see what Ask Orrery does with them.
Questions you can ask
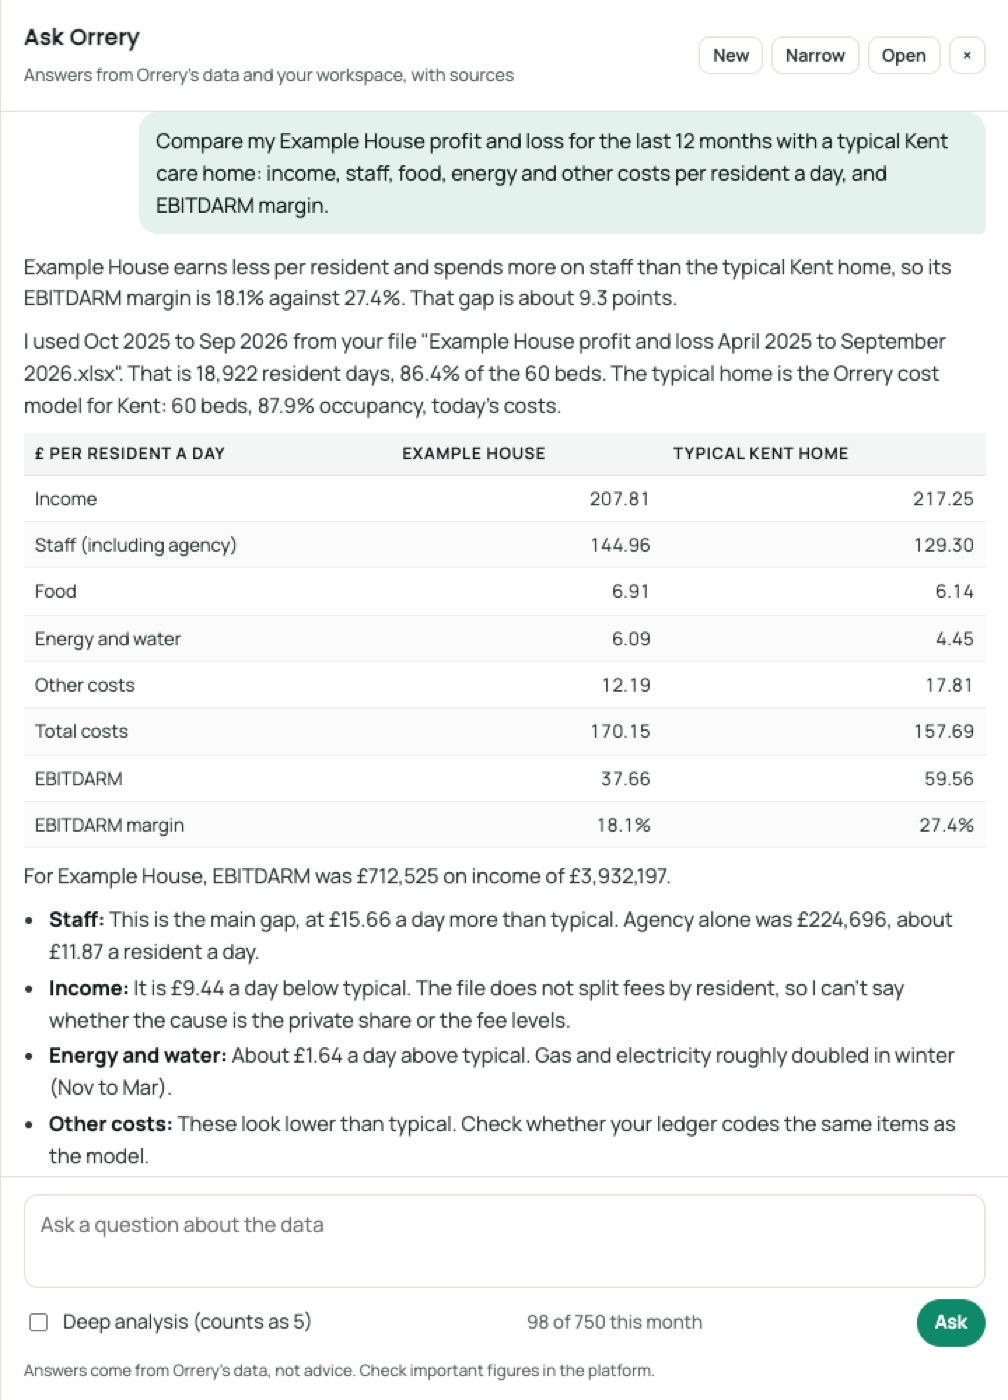
- “Compare my Example House profit and loss for the last 12 months with a typical Kent care home: income, staff, food, energy and other costs per resident a day, and EBITDARM margin.”
- “Which three costs are furthest above typical, and what would bringing them to typical save a year?”
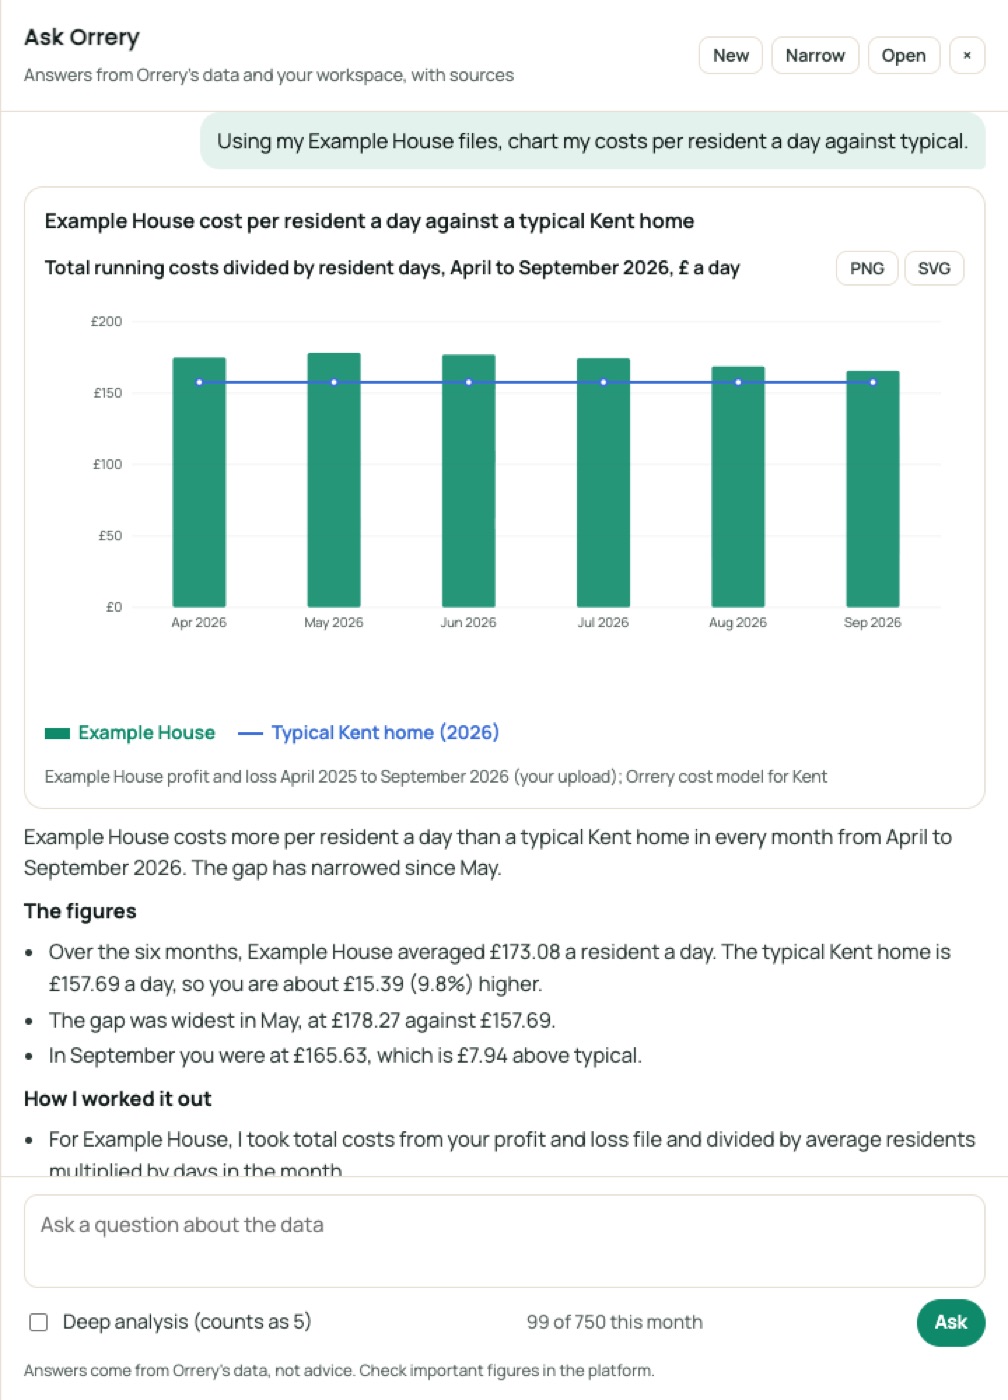
- “Chart my costs per resident a day against typical.”
Ask the data in plain English
A real question and answer from Ask Orrery, the assistant inside the platform, using the Example Care Group sample files above (October 2026). It works from your files and Orrery's data, and shows its sources.
Your Example House made an EBITDARM margin of 18.1% over the last 12 months. The typical Kent home in the Orrery cost model makes 27.4%. The gap is mostly staff cost, with lower income per resident adding to it.
I used October 2025 to September 2026 from your "Example House profit and loss April 2025 to September 2026" file. That is 18,922 resident days, an average of about 52 residents in 60 beds. The Kent figures come from the Orrery cost model, a 60 bed home at 87.9% occupancy, shown on the model's 2026 basis.
| Per resident a day | Example House | Typical Kent home |
|---|---|---|
| Income | £207.81 | £217.25 |
| Staff | £144.96 | £129.30 |
| Food | £6.91 | £6.14 |
| Energy and water | £6.09 | £4.45 |
| Other costs | £12.19 | £17.81 |
| Total costs | £170.15 | £157.71 |
| EBITDARM | £37.66 | £59.56 |
| EBITDARM margin | 18.1% | 27.4% |
What stands out
- Staff: you spend about £15.66 a day more per resident. Staff are 85% of your costs. Agency alone is £224,696 over the year, about £11.87 a resident day.
- Income: you earn about £9.44 a day less per resident. The mix of funders, nursing share and fee levels could all explain this.
- Food and energy: both are slightly above the model. Electricity and gas alone are £4.80 a day.
- Other costs: these are lower than the model, but your costs may be grouped differently from the model's.
I counted all staff lines as staff: care, nurse, management and admin pay, employer NI, pension and agency. I counted water and waste with energy. The model may group costs differently, so check this before relying on the comparison. The Kent figures are a model, not a forecast.
The "Benchmark your home against local homes" and "Your accounts against a typical home in your council" guides cover this next step. If you want, I can look at agency use or your fee levels against Kent's private fees.
Open in Orrery: /app/projections?council=kent
Ask, chart and report, in plain English
Ask Orrery answers from Orrery's data and your own files, draws charts on request and builds reports you can save as PDF. These are real examples made with the sample files.
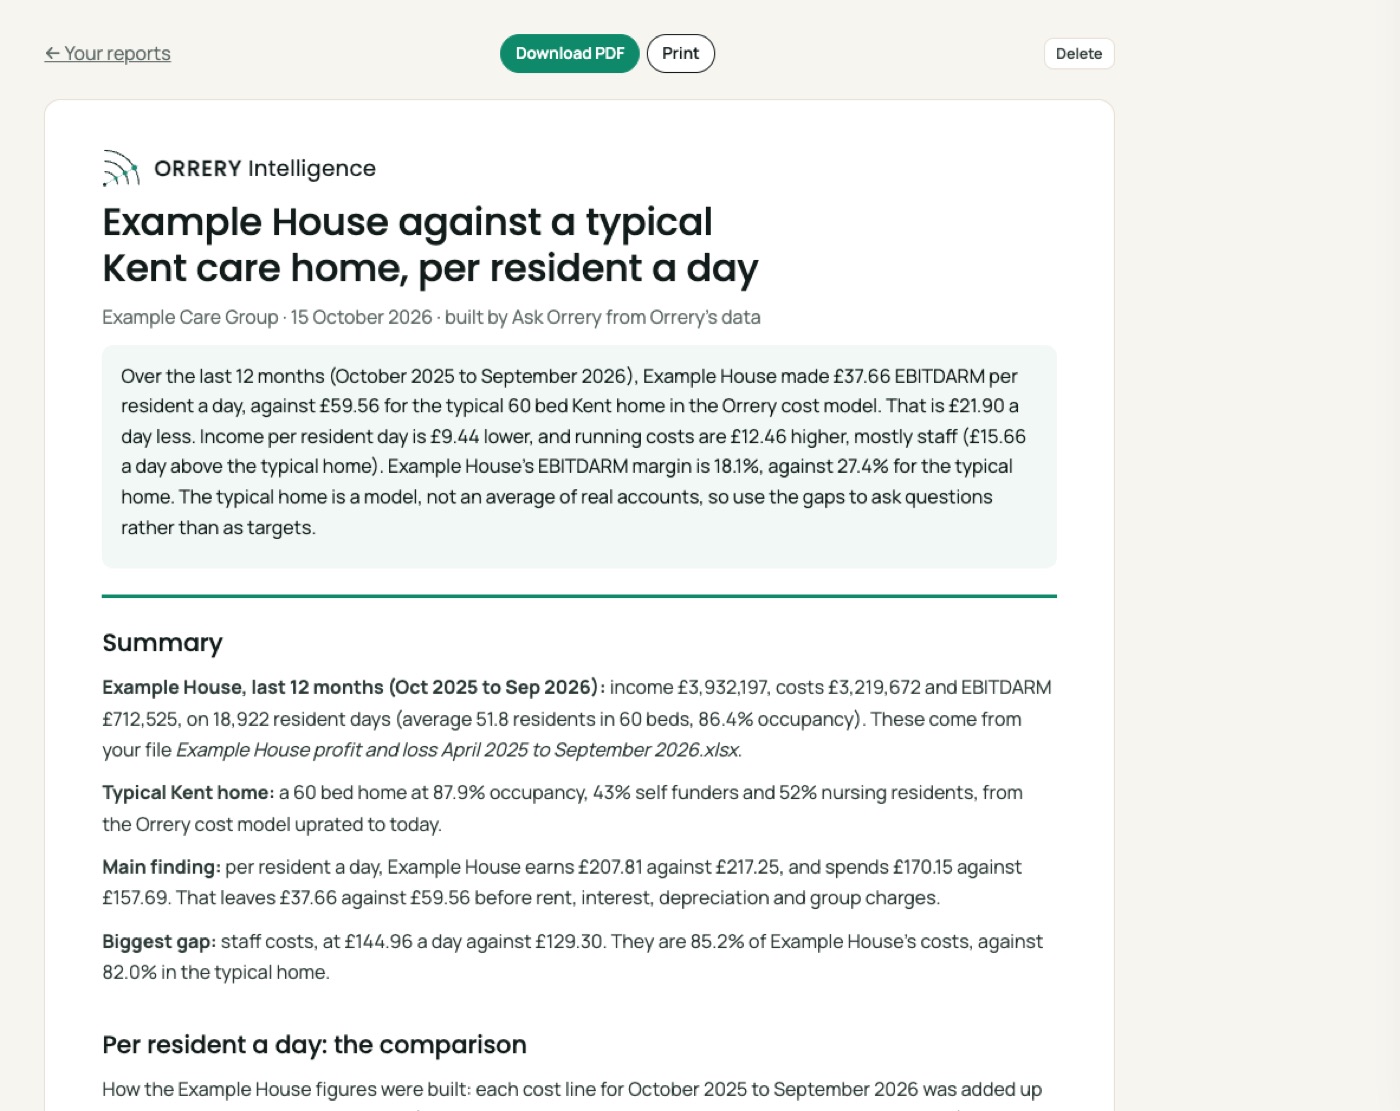
- The typical home is a model, not an average of real accounts: use it to ask questions, not as a target.
- Rent, interest and group charges sit below EBITDARM; compare before them.
Answer this with your own files
Subscribers get every guide, chart and projection for all 153 councils, Ask Orrery with private uploads of their own files, and every council report.
The Orrery platform opens to subscribers shortly. Register and we will tell you first.
Register for early access