Food, energy and supplier spend check
What do we spend per resident a day on food, energy and other supplies, and how does it compare and change?
Upload supplier invoices. Ask Orrery groups spend by category and month, works out cost per resident a day, and compares it with the typical home and expected price rises.
When people use it: Quarterly, and before supplier or energy contracts renew.
How it works, step by step
Upload invoices
A ledger export by supplier and month is enough.
Per resident a day
Winter energy can be half as much again as summer; compare like months.
Benchmarks
Typical food and energy per resident a day and expected rises.
What you upload
- Supplier invoices or a purchase ledger export
- Optionally, occupancy by month
Files are stored privately for your account, never shared with anyone and never used to train AI. You can delete them at any time. Spreadsheets, CSV, PDF and Word files all work, in your own layout.
Try it with sample files
Made up files for a made up provider, Example Care Group, so you can see what Ask Orrery does with them.
Questions you can ask
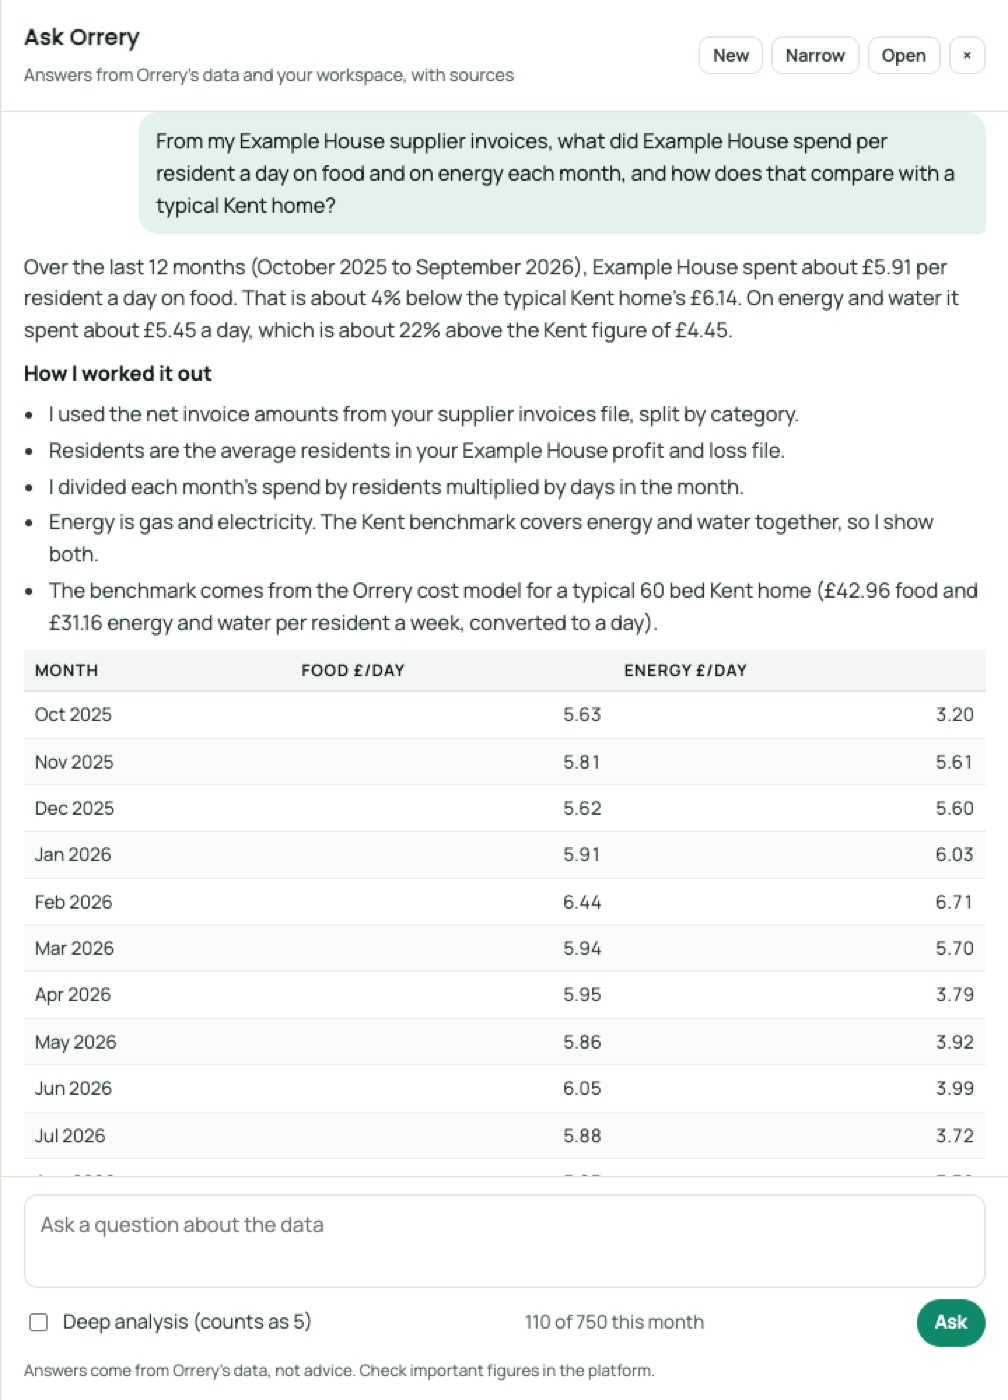
- “From my Example House supplier invoices, what did Example House spend per resident a day on food and on energy each month, and how does that compare with a typical Kent home?”
- “What were our electricity and gas unit prices before and after April, and what will next year cost if usage stays the same?”
Ask the data in plain English
A real question and answer from Ask Orrery, the assistant inside the platform, using the Example Care Group sample files above (October 2026). It works from your files and Orrery's data, and shows its sources.
Over the last 12 months (October 2025 to September 2026), Example House spent about £5.91 a resident a day on food and £5.45 on energy and water. A typical Kent home is modelled at £6.14 for food and £4.45 for energy and water. Food is slightly below that benchmark. Energy and water are about 22% above it, driven by winter.
How I worked it out. I took net invoice amounts (before VAT) from your supplier invoices file. I divided each month's total by average residents × days in the month, using residents from your Example House profit and loss. The Kent benchmark combines energy and water, so I show both ways.
| Month | Food | Energy only | Energy + water |
|---|---|---|---|
| Apr 25 | £5.78 | £3.71 | £4.58 |
| May 25 | £5.60 | £3.48 | £4.29 |
| Jun 25 | £5.83 | £3.44 | £4.30 |
| Jul 25 | £5.59 | £3.44 | £4.25 |
| Aug 25 | £5.65 | £3.37 | £4.15 |
| Sep 25 | £5.84 | £3.55 | £4.39 |
| Oct 25 | £5.63 | £3.20 | £4.00 |
| Nov 25 | £5.81 | £5.61 | £6.42 |
| Dec 25 | £5.62 | £5.60 | £6.41 |
| Jan 26 | £5.92 | £6.03 | £6.88 |
| Feb 26 | £6.44 | £6.71 | £7.63 |
| Mar 26 | £5.94 | £5.71 | £6.49 |
| Apr 26 | £5.95 | £3.79 | £4.67 |
| May 26 | £5.86 | £3.92 | £4.77 |
| Jun 26 | £6.05 | £3.99 | £4.87 |
| Jul 26 | £5.88 | £3.72 | £4.53 |
| Aug 26 | £5.85 | £3.52 | £4.32 |
| Sep 26 | £6.08 | £3.75 | £4.58 |
What it shows
- Food: this is steady at £5.60 to £6.44. Since April 2026 it has been £5.85 to £6.08, close to the Kent figure of £6.14.
- Energy and water: summer 2026 is £4.32 to £4.87, around the £4.45 benchmark. From November to March it runs at £6.41 to £7.63. Your energy invoices rose from about £5.3k to about £9k a month in November 2025 and fell back in April 2026, so check whether that was seasonal use or a tariff change.
Limits. Kent's figures come from the Orrery cost model. They are a modelled typical 60 bed home at 87.9% occupancy, not a measured average, and they don't vary by season. Compare like months, so winter against winter. Your invoice energy also differs a little from the electricity and gas lines in your profit and loss.
Open in Orrery: /app/guides/food-energy?council=kent. The supplier-spend guide is at /app/guides/supplier-spend?council=kent.
Ask, chart and report, in plain English
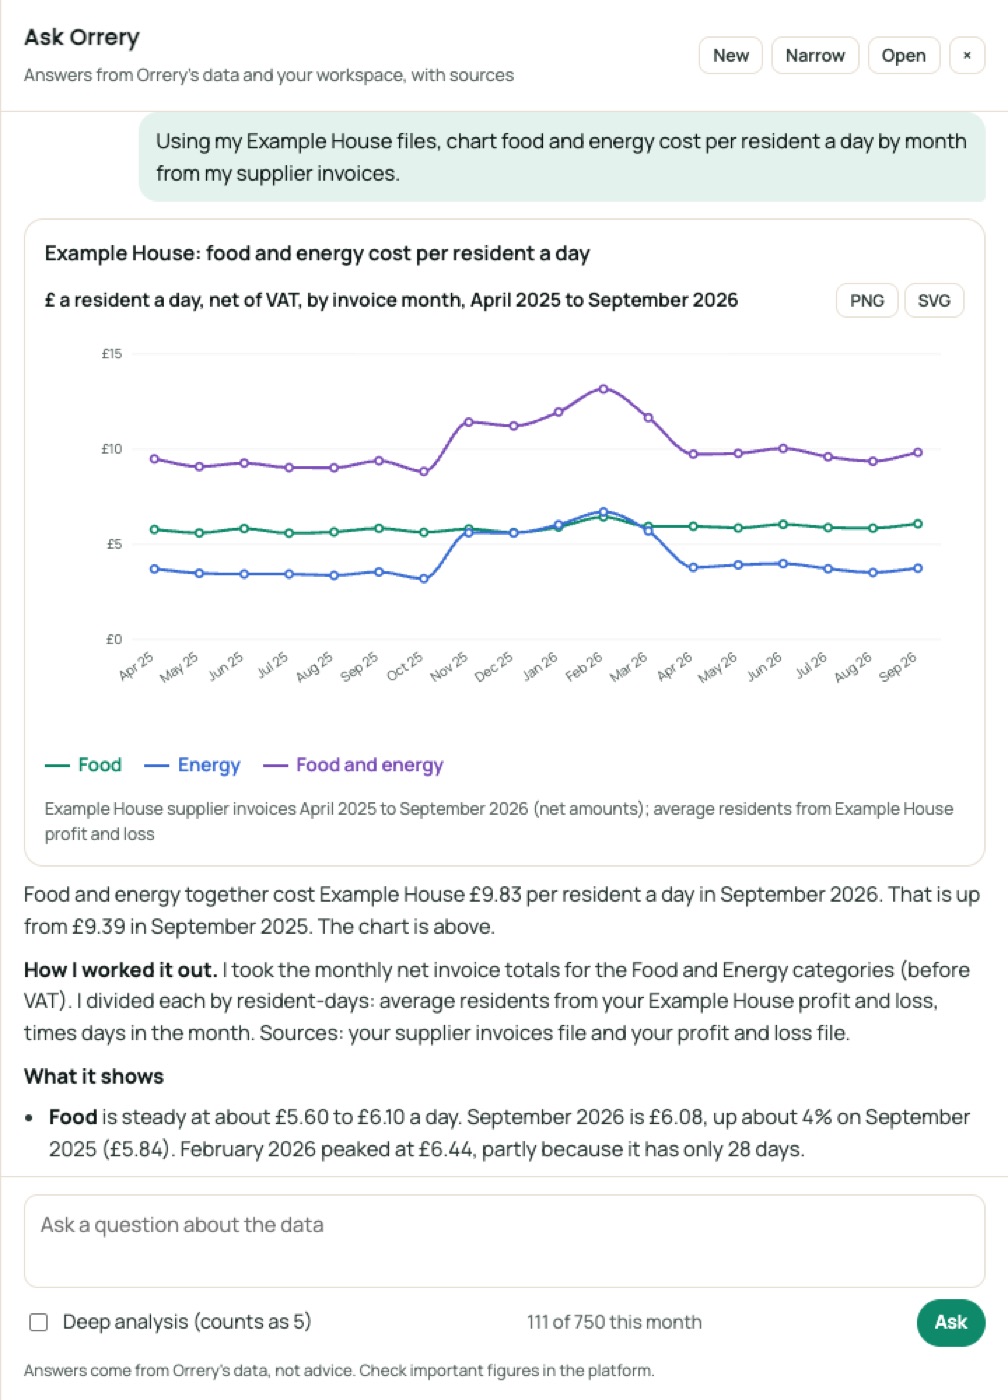
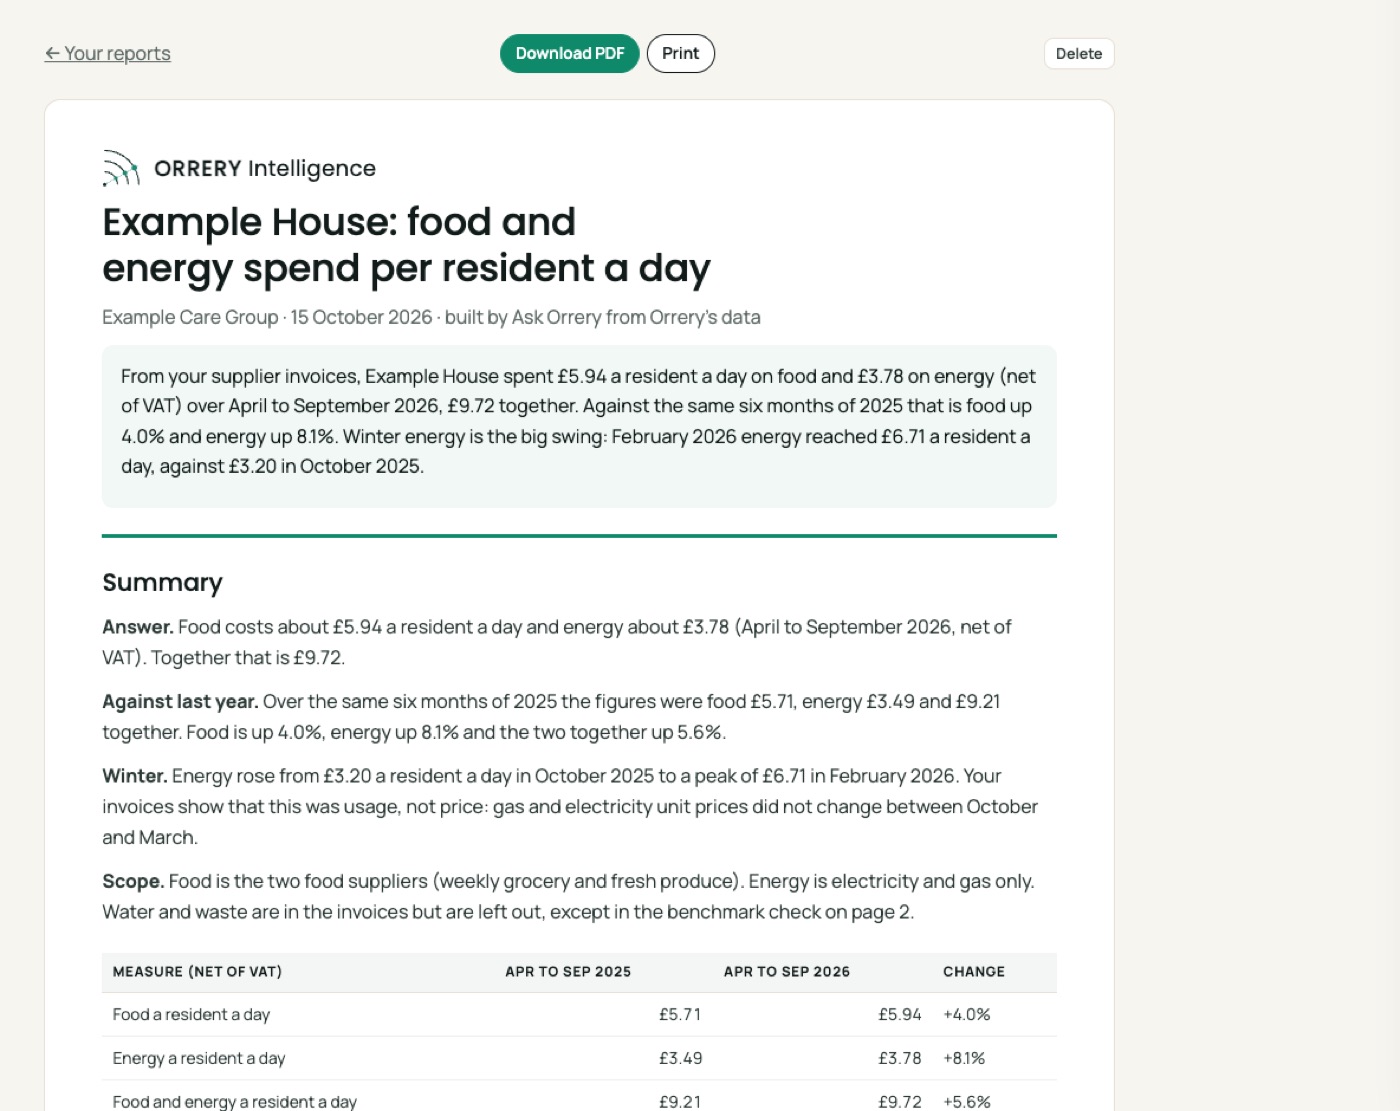
Ask Orrery answers from Orrery's data and your own files, draws charts on request and builds reports you can save as PDF. These are real examples made with the sample files.
- Unit prices tell you whether a rise is price or usage.
Answer this with your own files
Subscribers get every guide, chart and projection for all 153 councils, Ask Orrery with private uploads of their own files, and every council report.
The Orrery platform opens to subscribers shortly. Register and we will tell you first.
Register for early access