Buying a care home or group
Is the target in a healthy market, and what will its income and costs look like after we buy it?
Map the target's homes, check each local market, test the margin, and look for consolidation and quality risks.
When people use it: At first look and again in due diligence.
How it works, step by step
The target's homes
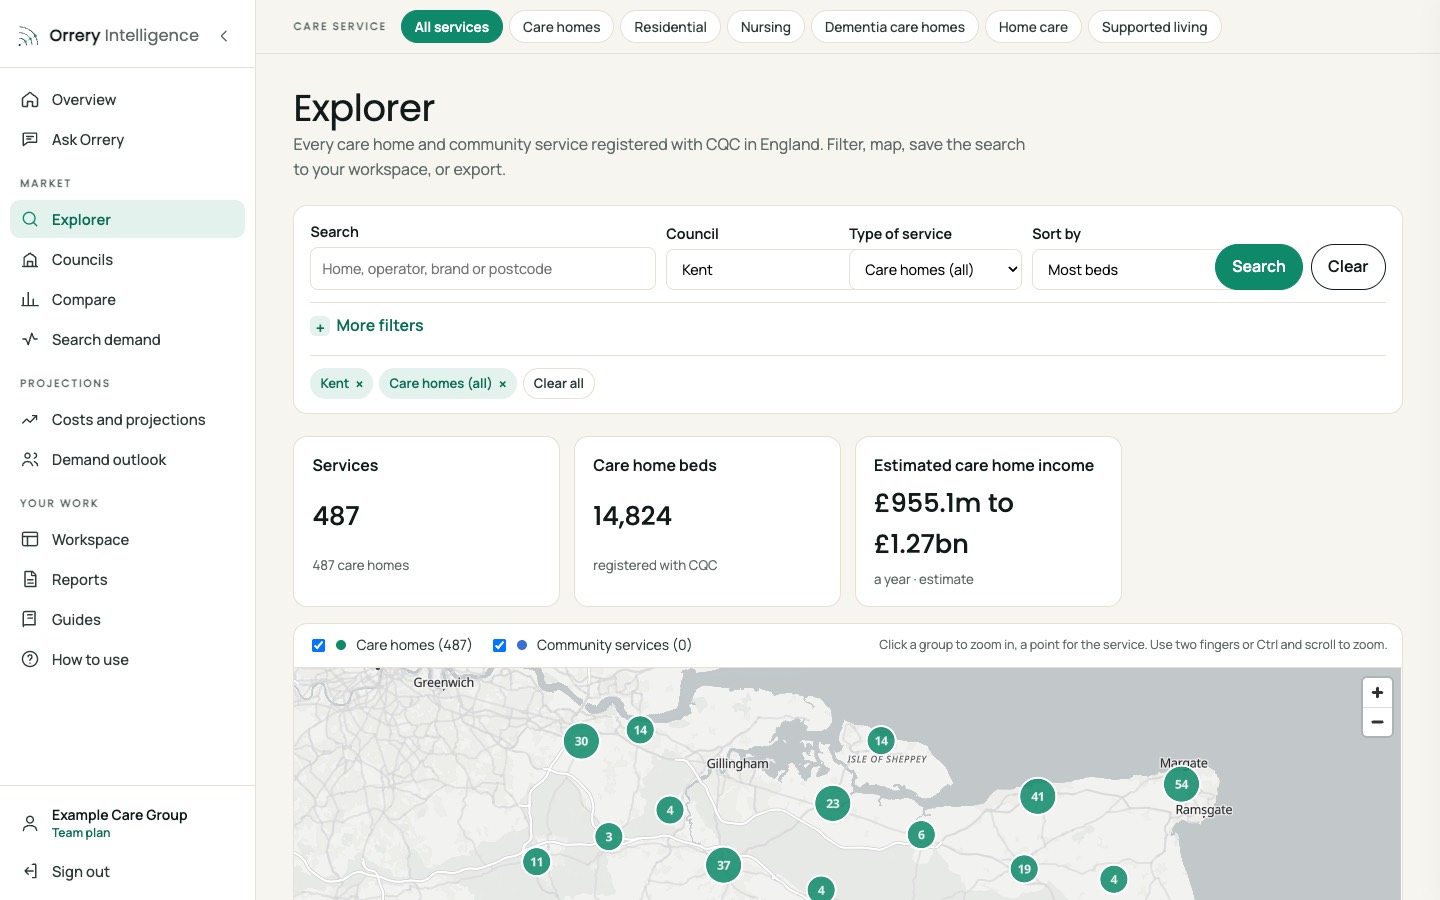
Search the operator's name: every home, its rating, beds and estimated income range. Export the list (CSV).
Each home's market
For each council the group operates in: occupancy, fees, 85+ growth and quality against England.
Consolidation in the area
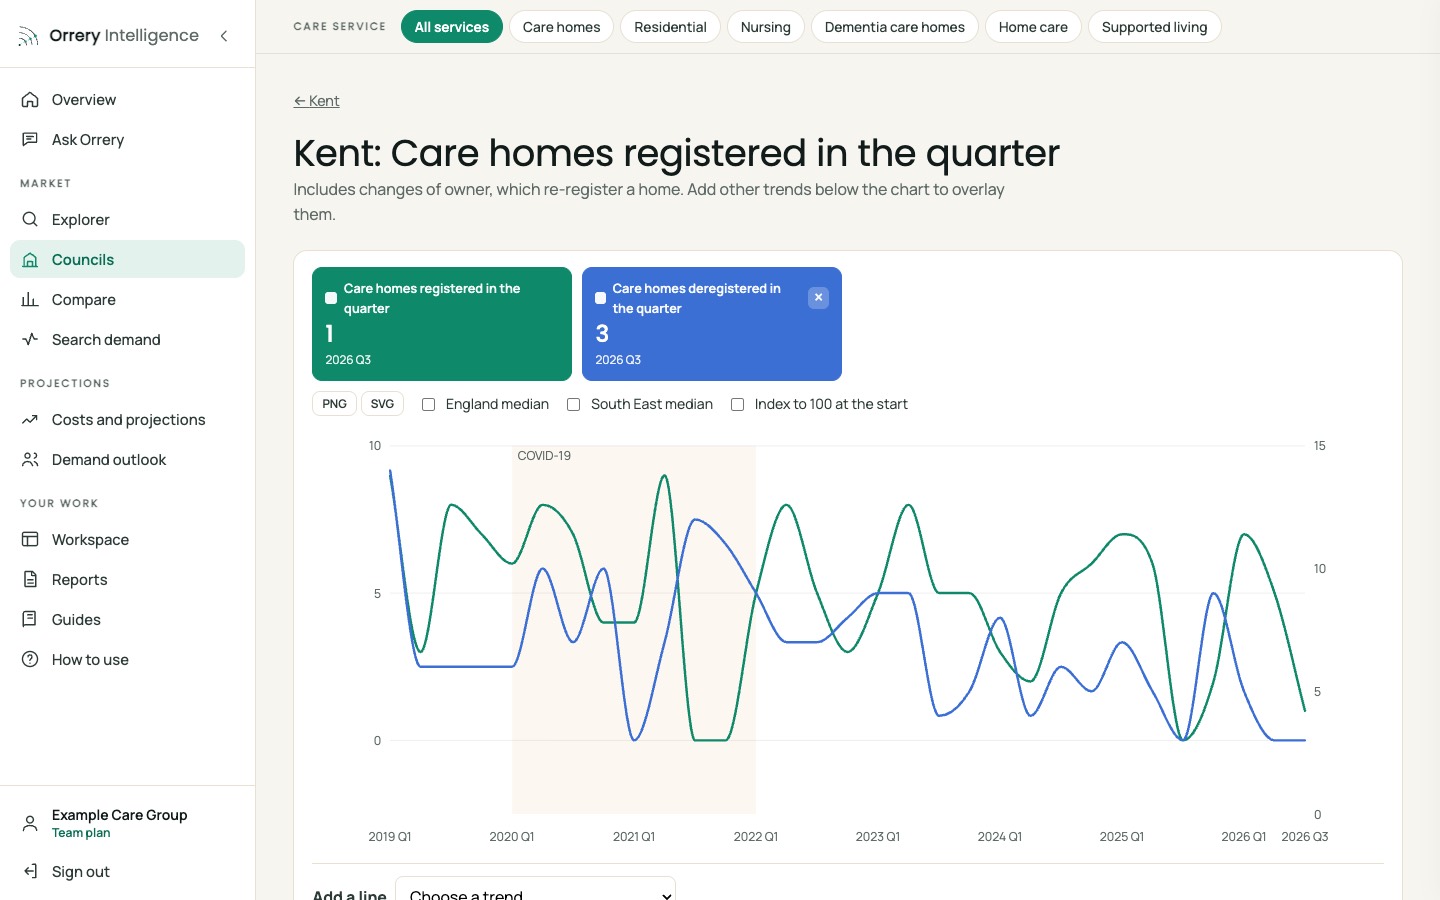
Runs of registrations and deregistrations at the same time often mean portfolio sales: who is buying in this market?
Quality risk
How does the local share rated Good or better compare with England? Poorly rated targets in strong markets are turnaround opportunities; in weak markets they are risks.
Margin after purchase
Model each home with its own beds, fees and occupancy; test your pay plans and fee strategy.
The views you will use
Ask the data in plain English
A real question and answer from Ask Orrery, the assistant inside the platform, for a care home owner in Kent (October 2026). It answers only from Orrery's data and the subscriber's own documents, and shows its sources.
A buyer should check supply against need, fees, occupancy, quality and margin. Kent is the largest market in England, so local detail matters.
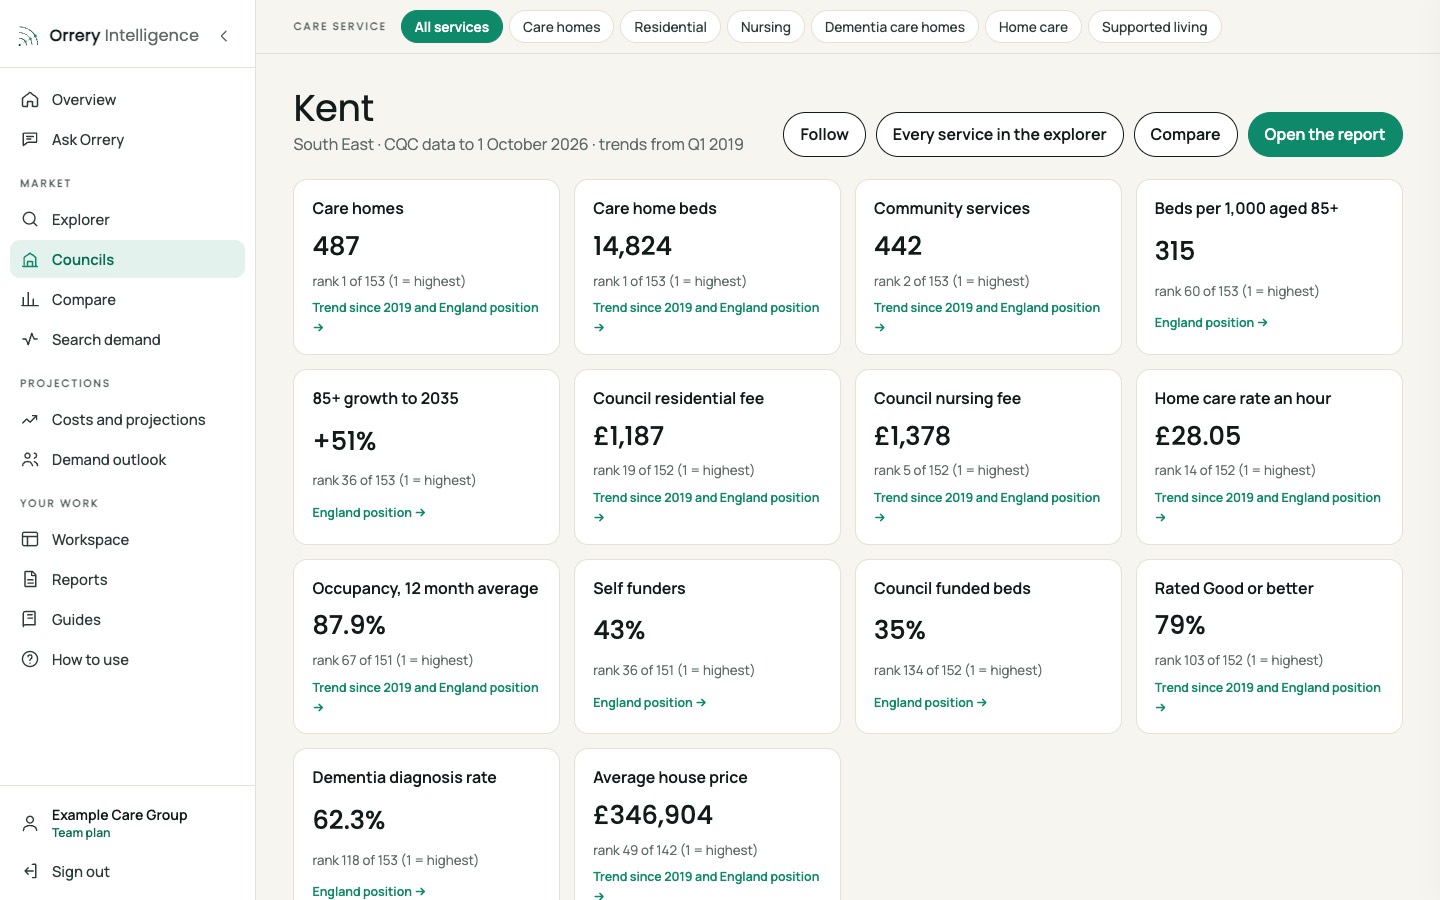
- Supply: 487 care homes and 14,824 beds, both 1st of 153 (CQC care directory). Orrery's model shows 3,250 spare beds in 2030 and 2,241 in 2035. That is on stated assumptions, not a forecast.
- Demand: The 85+ population is projected to grow 51% to 2035, against an England median of 41% (ONS).
- Income: The council residential fee is £1,187 a week and the nursing fee is £1,378 (DHSC MSIF). Self funders are 43% of residents, against 33% for England.
- Occupancy: The 12 month average is 87.9%, close to the England median of 87.7%.
- Quality: 79% of homes are rated Good or better, against 84% for England.
- Margin: The typical EBITDARM is 27.4% (Orrery cost model).
Check these at district level, not just county level. Take professional advice before you commit.
- Price the market, not just the home: a good home in a market that is about to become oversupplied is worth less.
Answer this for your own councils
Subscribers get every guide, chart and projection for all 153 councils, Ask Orrery, and every council report.
The Orrery platform opens to subscribers shortly. Register and we will tell you first.
Register for early access