Staff hours per resident against occupancy
How many care hours a resident a week do we provide, and does staffing follow occupancy up and down?
Upload payroll and occupancy. Ask Orrery works out care hours per resident a week by month, compares it with occupancy, and shows the cost of each extra hour.
When people use it: Monthly, and whenever occupancy moves.
How it works, step by step
Upload payroll and occupancy
Ask Orrery separates care roles from kitchen, housekeeping and admin.
Hours per resident
Hours per resident that stay flat while occupancy falls means rising cost per resident.
How full the market is
Your occupancy against the council and England, to judge whether more residents are realistic.
What you upload
- Payroll or rota hours by month
- Average residents by month
Files are stored privately for your account, never shared with anyone and never used to train AI. You can delete them at any time. Spreadsheets, CSV, PDF and Word files all work, in your own layout.
Try it with sample files
Made up files for a made up provider, Example Care Group, so you can see what Ask Orrery does with them.
Questions you can ask
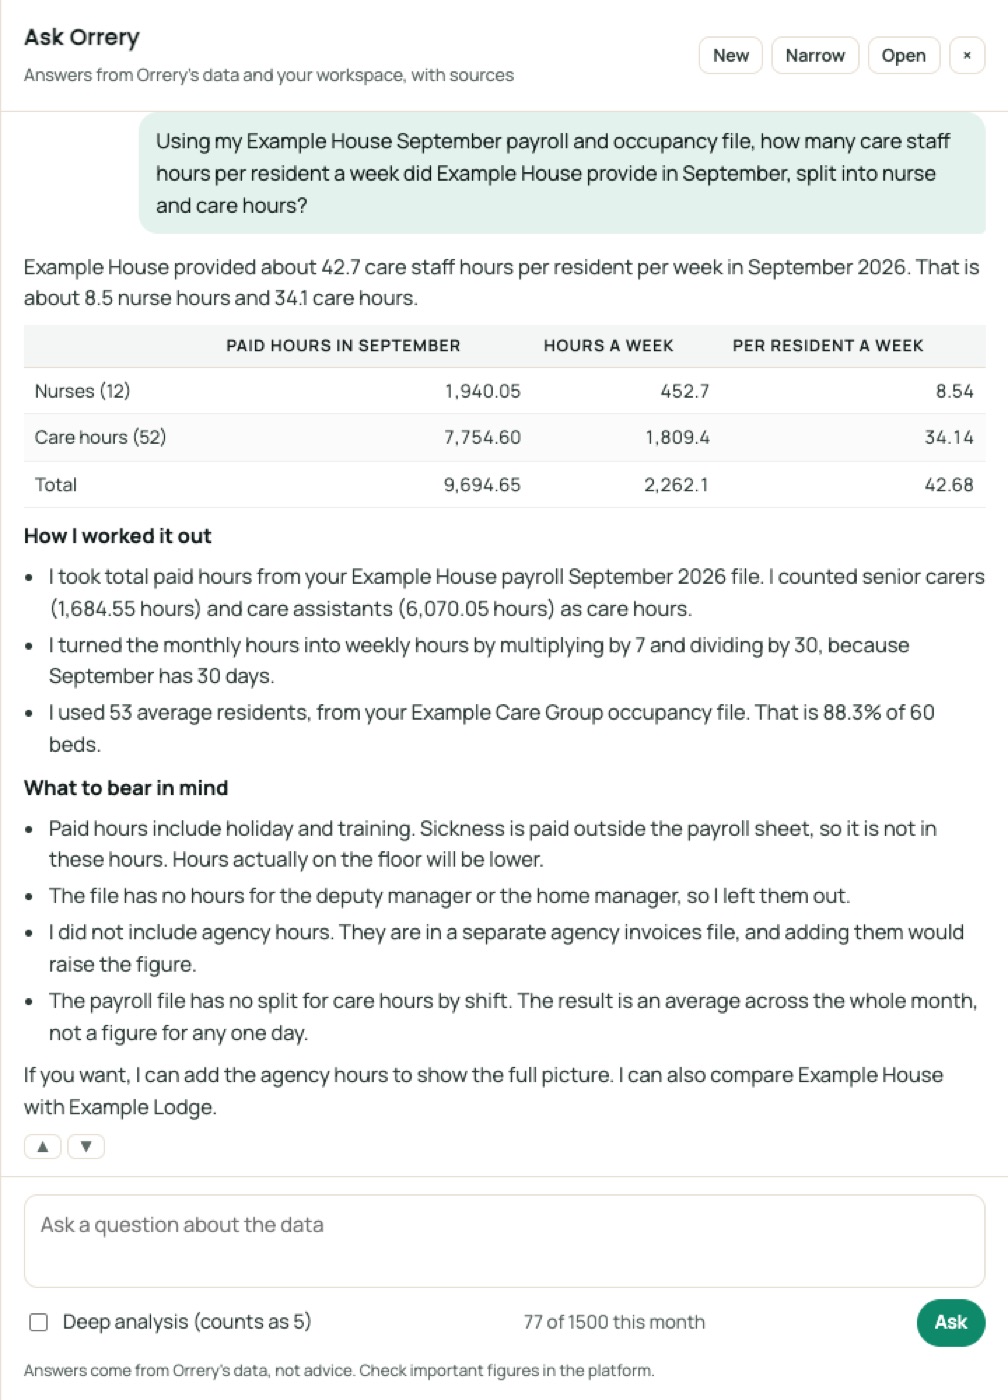
- “Using my Example House September payroll and occupancy file, how many care staff hours per resident a week did Example House provide in September, split into nurse and care hours?”
- “If occupancy rose to 57 residents, how many more care hours would we need at the same ratio, and what would they cost?”
Ask the data in plain English
A real question and answer from Ask Orrery, the assistant inside the platform, using the Example Care Group sample files above (October 2026). It works from your files and Orrery's data, and shows its sources.
In September 2026 Example House provided about 38.2 care staff hours per resident per week. Of those, about 7.8 were nurse hours and 30.3 were care hours.
How I worked it out
- I used hours actually worked (weekday plus weekend) from the Example House payroll September 2026 file.
- That is 1,779.25 nurse hours (12 nurses) and 6,889.00 care hours.
- The care hours are 5,342.25 from care assistants and 1,546.75 from senior carers.
- I turned the monthly hours into weekly hours by dividing by 30 days and multiplying by 7.
- I used 53 average residents in September, from the Example Care Group occupancy file (88.3% of 60 beds).
| Hours worked in Sept | Hours a week | Per resident a week | |
|---|---|---|---|
| Nurse | 1,779.25 | 415.2 | 7.8 |
| Care (care assistants and senior carers) | 6,889.00 | 1,607.4 | 30.3 |
| Total | 8,668.25 | 2,022.6 | 38.2 |
What I left out
- The home manager and deputy manager are salaried and have no hours recorded, so they are not counted.
- Cooks, kitchen, housekeeping, laundry, maintenance, activities and admin staff are not counted.
- Holiday, sick and training hours are not counted as care delivered.
If you count all paid hours, which include holiday and training, the figures are higher. Nurse hours become 8.5 per resident per week and care hours 34.1. Sick hours are left out of paid hours because the sheet says sickness is paid as SSP outside it.
Higher hours per resident usually mean higher staff cost per resident. Compare the figure with your occupancy over time, because hours per resident fall when occupancy rises on a fixed rota. The "staffing-per-resident" guide in Orrery covers this.
Ask, chart and report, in plain English
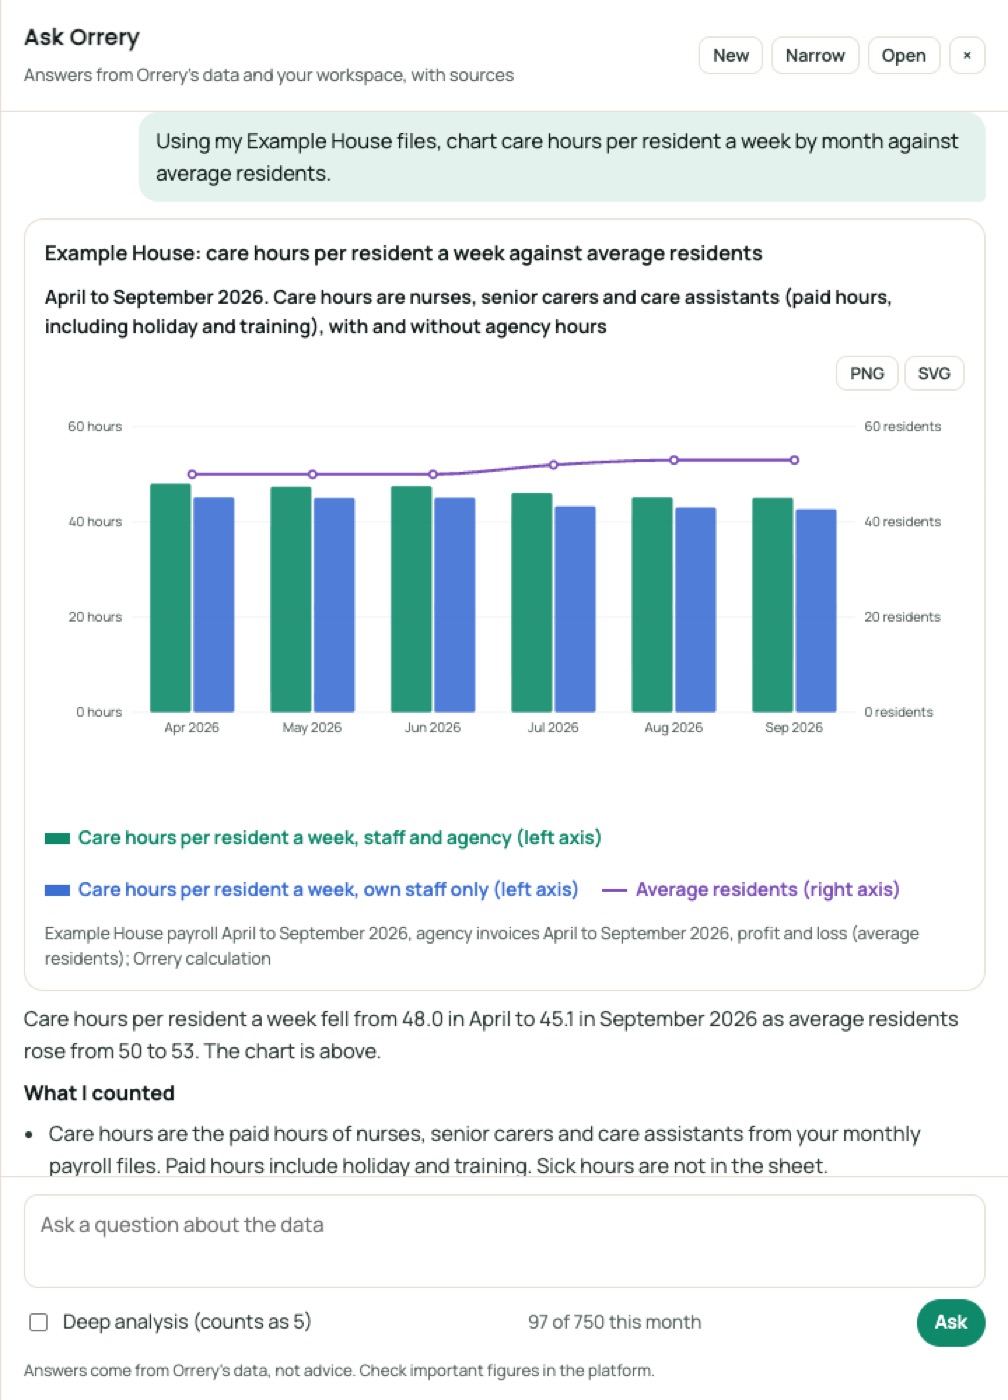
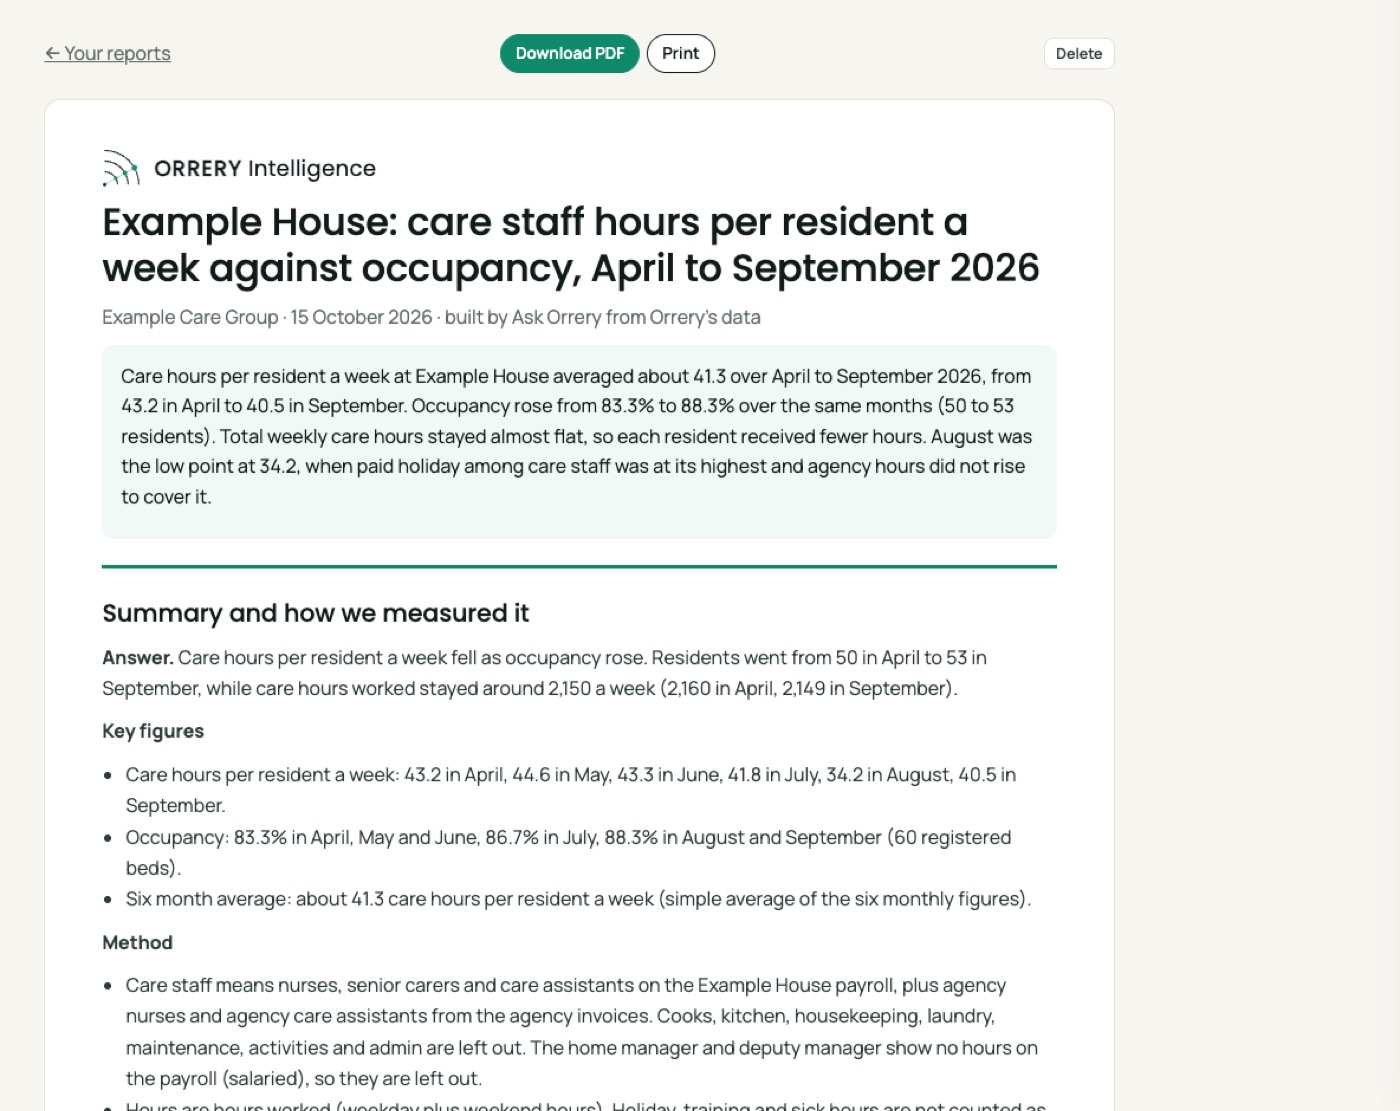
Ask Orrery answers from Orrery's data and your own files, draws charts on request and builds reports you can save as PDF. These are real examples made with the sample files.
- Dependency matters: a home with more nursing or dementia residents needs more hours, so compare with your own history first.
Answer this with your own files
Subscribers get every guide, chart and projection for all 153 councils, Ask Orrery with private uploads of their own files, and every council report.
The Orrery platform opens to subscribers shortly. Register and we will tell you first.
Register for early access