The local care market, understood
Independent reports on every council area in England: who needs care, who provides it, what it pays and what the council plans next. Built by people who have worked in care.
- CQCCare Quality Commission
- ONSPopulation and Census 2021
- DHSCCouncil fees and occupancy
- NHS EnglandDementia and discharge
- Companies HouseOwners and lenders
- HM Land RegistryHouse prices
- DWPAttendance Allowance
- Food Standards AgencyHygiene ratings
One report per council. Every figure sourced.
Demand to 2035, every care home and agency, council fees and who pays, owners and lenders, and what the council says it wants, explained in plain English for 153 council areas.
Official data
CQC, ONS, DHSC, NHS and Companies House, combined council by council and checked against source.
Our sourcesCare expertise
Written by people who have run and worked in nursing and care homes, not just analysts.
About usEvery district
Supply, demand and quality for every district, with every home of 20 beds or more named.
See a districtMade for decisions
Buying a home, opening an agency, lending or bidding: each section ends with what it means for you.
Choose a reportPick the report for the decision you are making
Full market report
Care homes
Nursing homes
Home care
Full reports for Kent and West Sussex
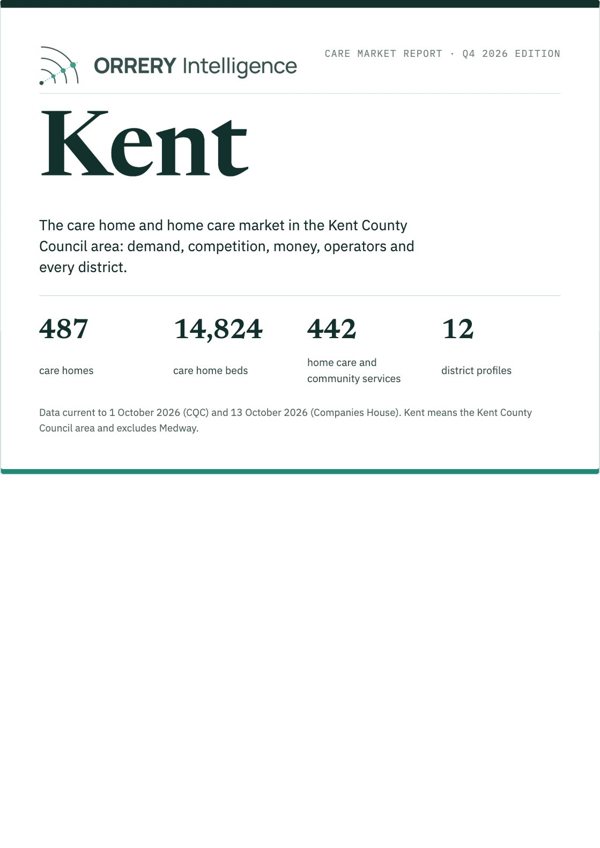
Kent care market report 2026
- 487 care homes
- 14,824 beds
- 442 home care services
- £1,187 a week council fee
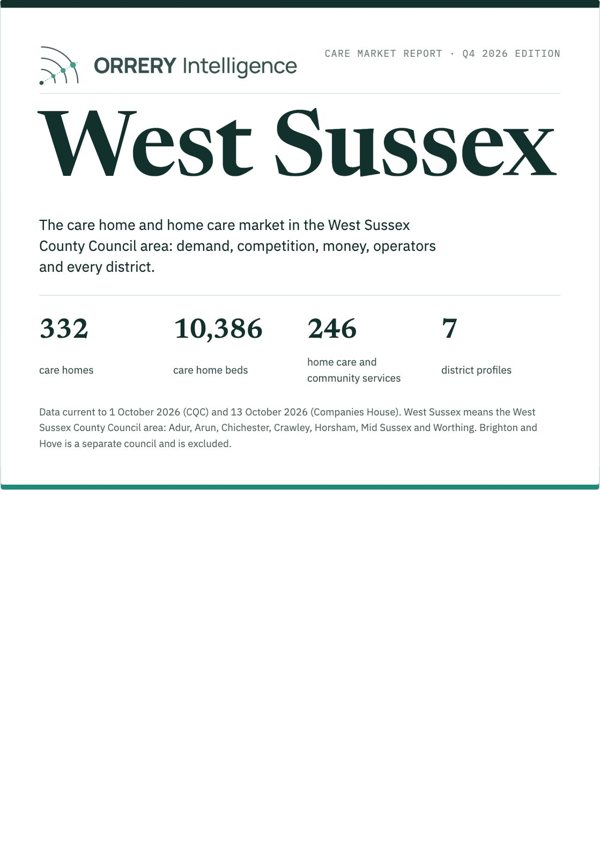
West Sussex care market report 2026
- 332 care homes
- 10,386 beds
- 246 home care services
- £1,033 a week council fee
Your council next?
Every other council has free headline figures today. Tell us which report you need and we will email you once when it is published.
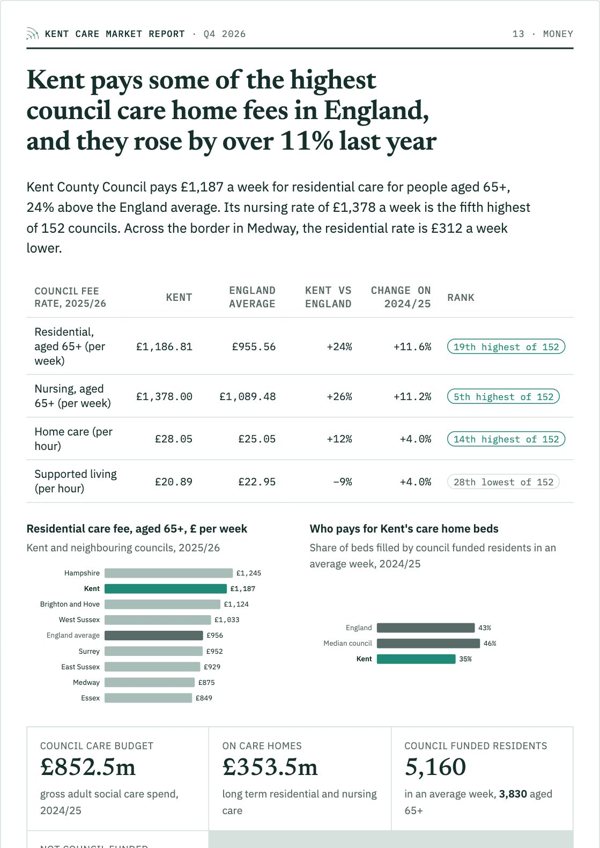
See the whole market before you commit
131 to 147 pages on one council: demand to 2035, every district profiled, operators and lenders, council fees and plans, and our view of where the opportunities are.
Choose your council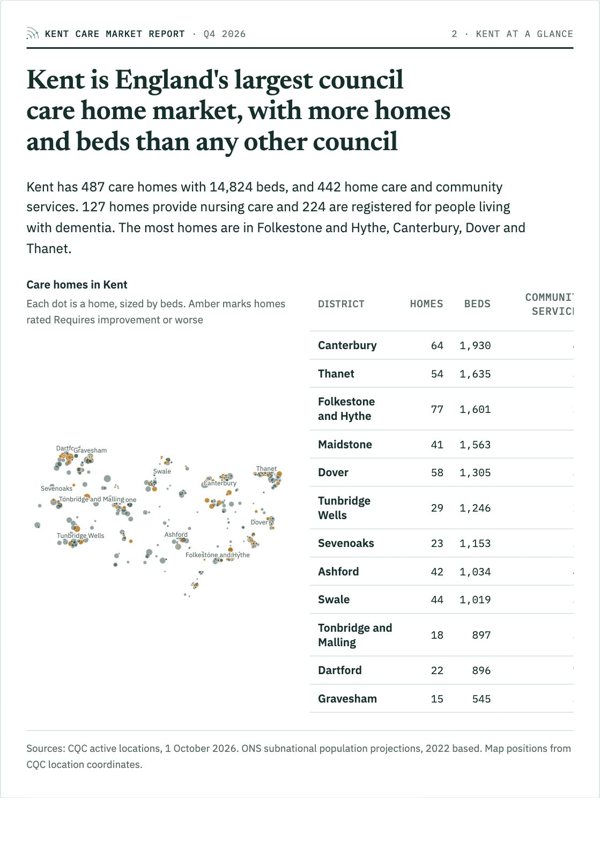
Just your part of the market
Focused reports for care home buyers, nursing operators and home care agencies, with every home or service in the council listed.
Compare the sector reportsEvery care service in England, on one map
All 30,135 registered services: 14,474 care homes (4,255 with nursing), sized by beds, and 15,661 home care and community services. Green shows the councils with a full report ready now; every other council already has free headline figures and is on the way.
From search to report in a few minutes
Pick your council
Search by council, town or postcode. Free headline figures for all 153 council areas, with 14,473 care homes tracked.
Read the free preview
Headline numbers, the map, the first findings and a free sample section, before you pay anything.
Buy and read straight away
Pay by card and open the web report at once. The PDF arrives by email, stamped with your name.
Made for the people making care decisions
Buying a care home
Demand, fees and every competitor around the home before you agree a price.
Care home reportStarting a home care agency
Where services are thin, what the council pays an hour and who is already there.
Home care reportRunning nursing homes
Dementia need, hospital pressure, nursing fees and FNC for the area.
Nursing home reportLending or advising
Evidence of demand, fees, funding mix and operator finances that you can cite.
Adviser licencePlanning growth or bidding
What the council says it wants, where beds will be short and what it will not buy.
Full market reportLatest from the data
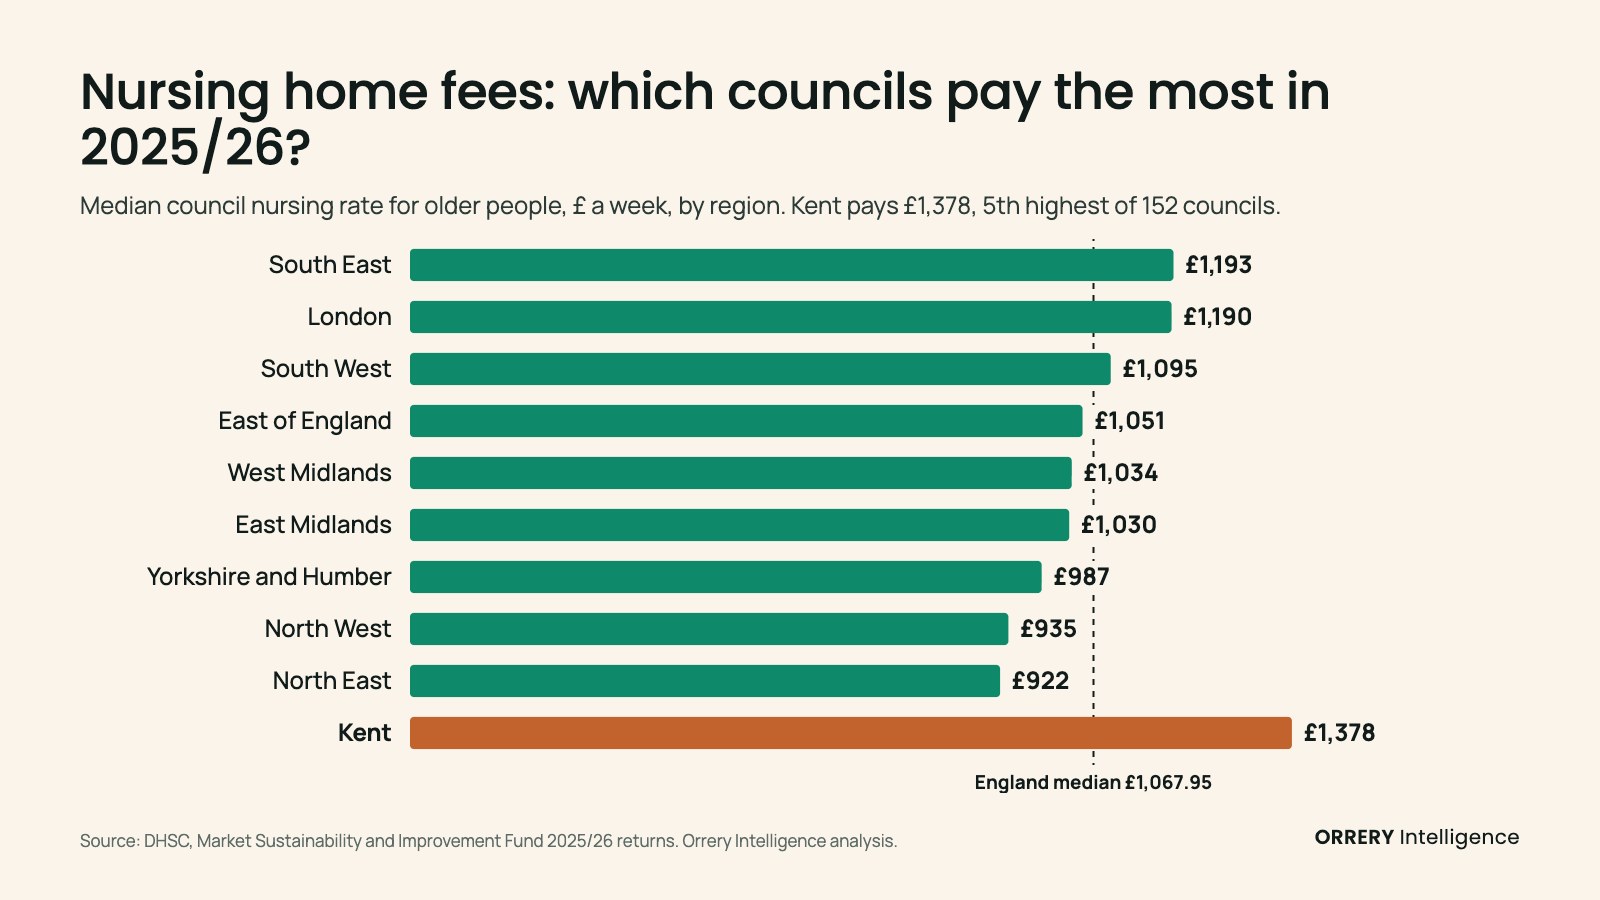
Nursing home fees: which councils pay the most in 2025/26?
Council nursing home fees for a week of care for an older person run from £712.63 in Nottingham to £1,809.97 in City of London. Kent pays the 5th...
Home care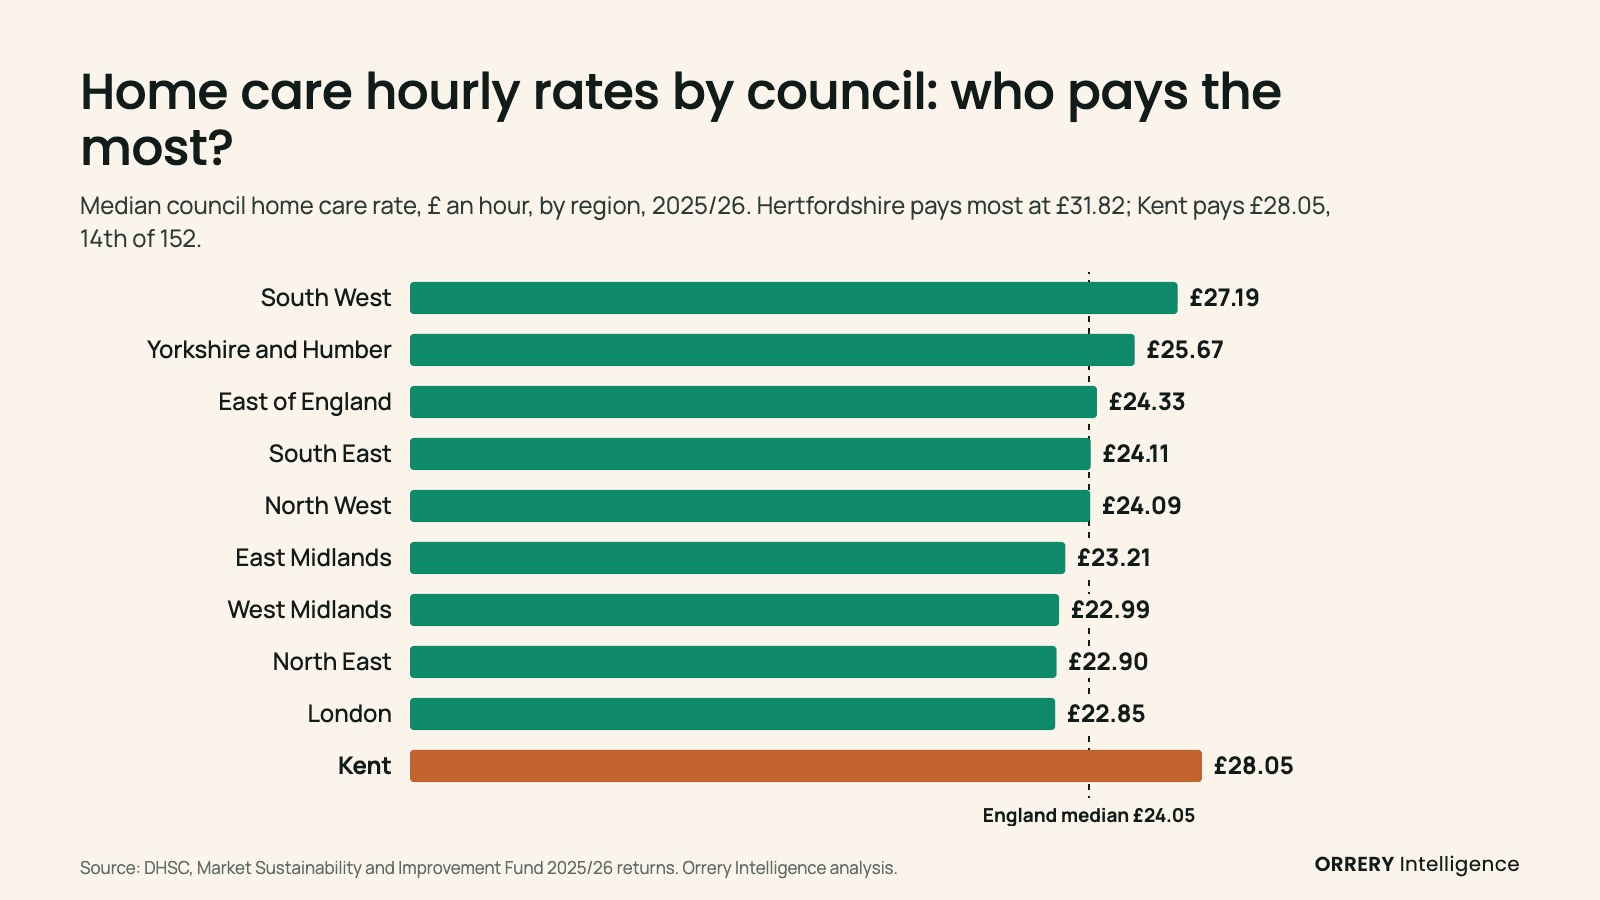
Home care hourly rates by council: who pays the most?
Councils paid a median £24.05 an hour for home care in 2025/26, from £31.82 in Hertfordshire to £18.45 in Harrow. London pays least. Kent pays...
Supply and demand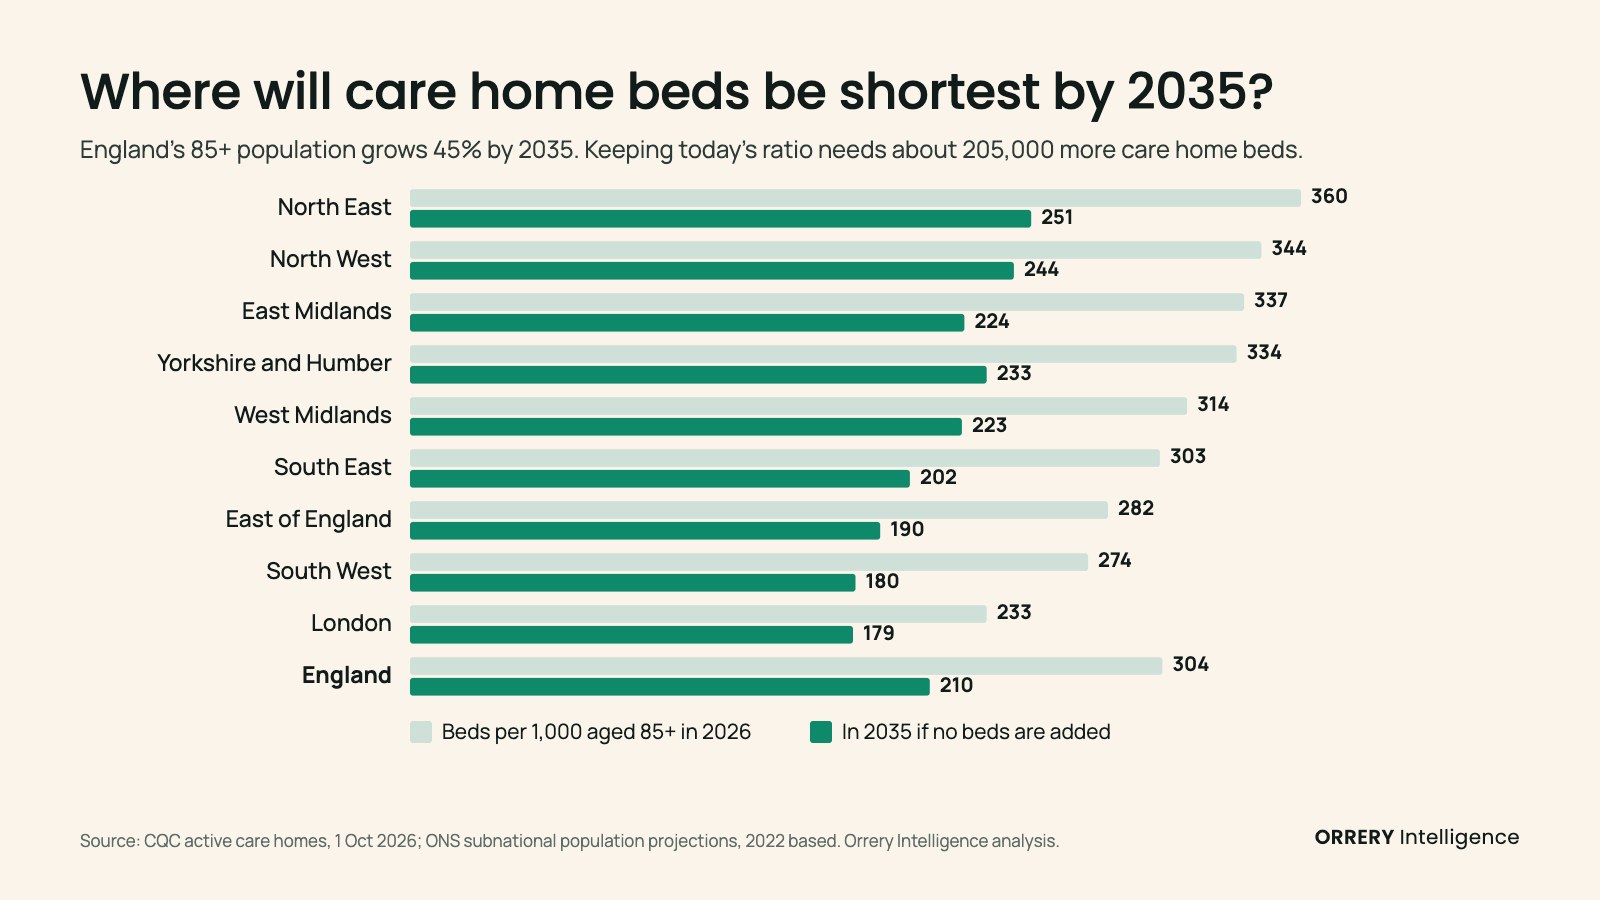
Where will care home beds be shortest by 2035?
England's 85+ population grows 45% by 2035. Holding today's ratio of beds to older people needs about 205,000 more care home beds. Here is where...
Before you buy
Anything else? Email hello@orreryintelligence.com and we reply within one working day.
Where does the data come from?
Official public sources: CQC registrations and ratings, ONS population projections, DHSC council fee returns, NHS dementia and hospital discharge data, Companies House and HM Land Registry. Every chart and table shows its source and date.
How up to date is it?
The Q4 2026 edition uses CQC data to 1 October 2026 and Companies House to 13 October 2026. Reports are refreshed every quarter, and if a new edition of your council comes out within 90 days of your purchase you get it free.
Which report should I buy?
The full market report covers everything for one council, with a profile of every district. If you only need one part of the market, the care home, nursing home and home care reports cost £195 and list every home or service in that sector.
Can I use it with my lender or clients?
The report is licensed for you and colleagues in your organisation. Brokers, lenders and consultants who use it with clients should choose the adviser licence, which allows charts in client work with a credit.
What do I actually receive?
Instant access to the web report and a PDF emailed to you, stamped with your name and order number. Your receipt and VAT invoice come by email straight after payment.
The monthly note on your council
New homes, closures, rating changes and fee news, once a month. Email only, and you can leave at any time.