Workforce Intelligence
See the people side of the market: how many posts there are, how many are vacant, what care workers earn, how many leave each year, and how wage rises and borrowing weigh on operators.
Get the full picture
Count the workforce
Filled and vacant posts in adult social care in the area.
Compare pay
Care worker pay against England and the wage floor.
Measure churn
Staff turnover and what it costs operators to keep staff.
Weigh the pressure
Wage and tax rises, nurse shortages and operator finances.
What you get, page by page
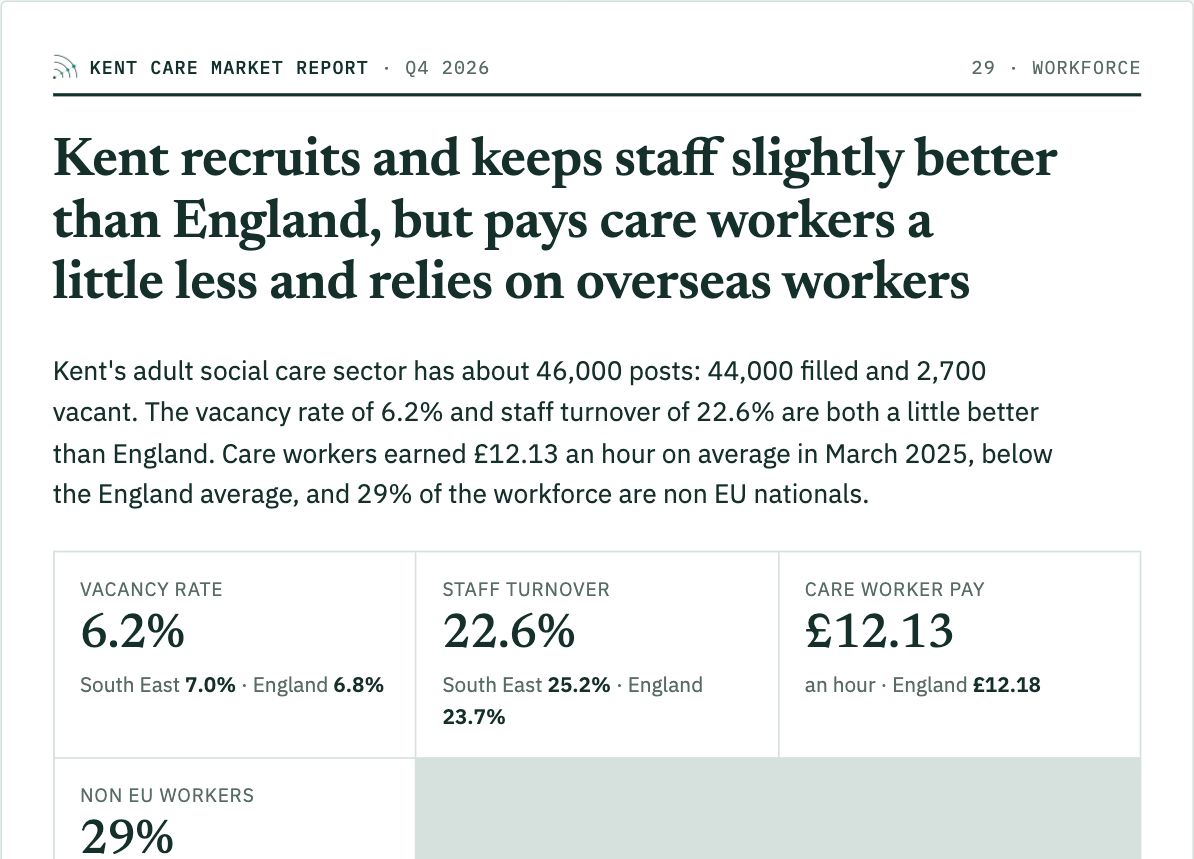
Workforce
Posts, vacancies, turnover and pay for the council area against England.
Kent report, Workforce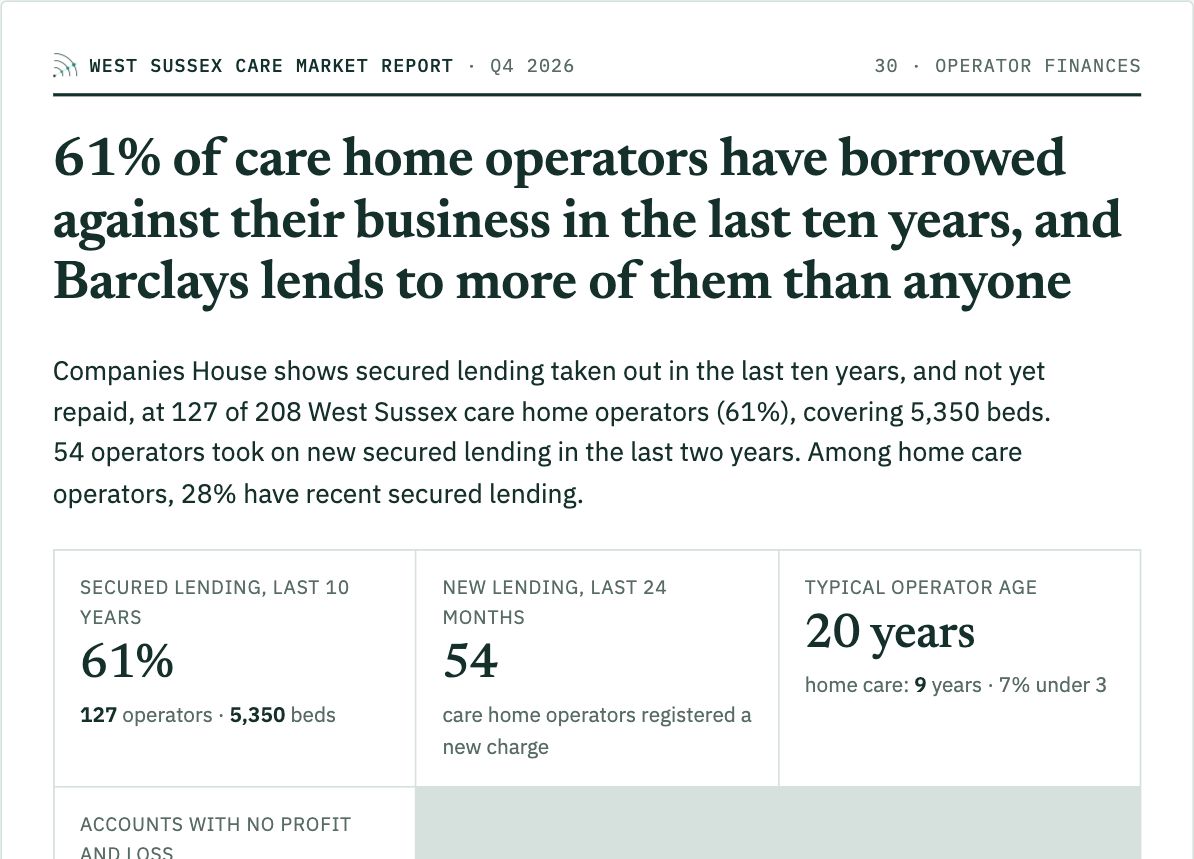
Operator finances
How many operators have borrowed against their business, who lends to them and how recent the borrowing is.
West Sussex report, Operator finances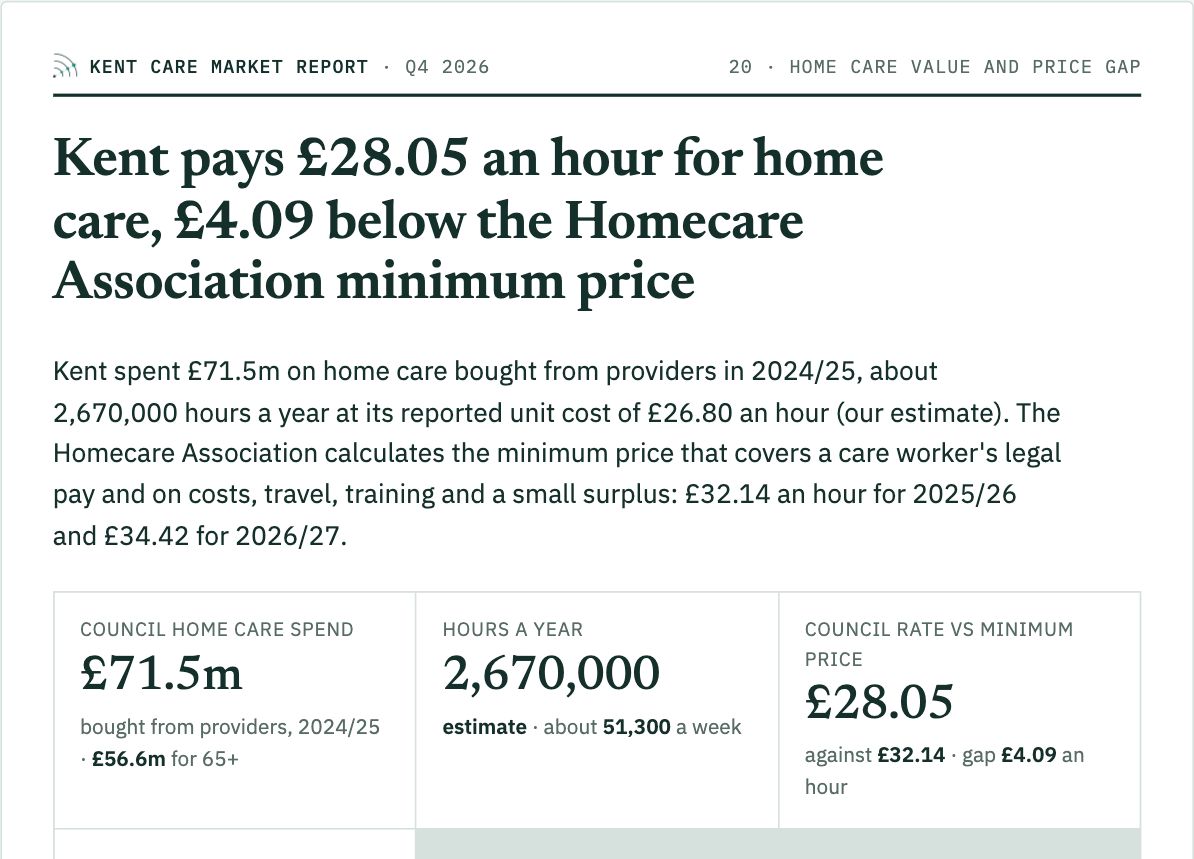
Home care price gap
What the council pays an hour for home care against the minimum price that covers legal pay and running costs.
Kent report, Home care value and price gap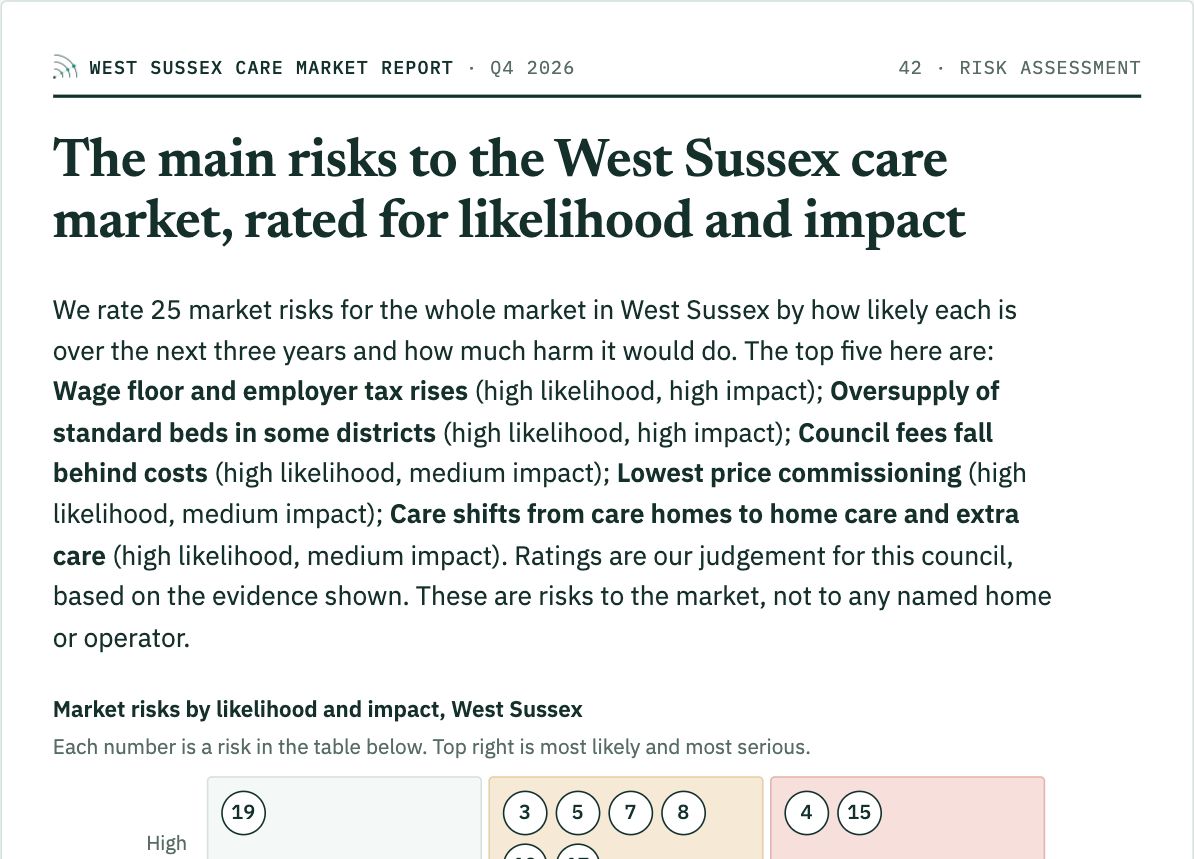
Workforce risks, rated
Wage floor, employer tax, recruitment and nurse shortages rated for likelihood and impact over three years.
West Sussex report, Risk assessmentEvery figure sourced and dated
Built from CQC, ONS, DHSC, NHS England, Companies House and council publications, refreshed every quarter.
- Posts, filled and vacant
- Vacancy rate
- Staff turnover
- Care worker pay against England
- National Living Wage exposure
- Secured lending by operators
- Home care price gap
- Workforce risks rated
Made for the decision in front of you
Operators
Plan pay and recruitment against what the local market pays.
Home care agencies
See whether council rates can cover the pay you need to offer.
Investors
Judge how exposed a business is to wage and tax rises.
One report, six kinds of intelligence
All six in one full market report
£295 + VAT per council, or £195 + VAT for a report on care homes, nursing homes or home care.