The full care market report for your council
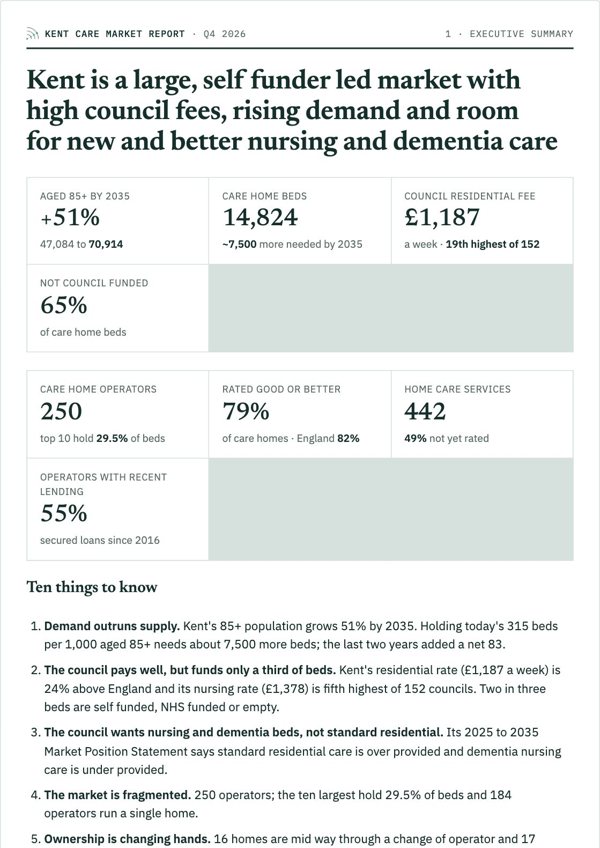
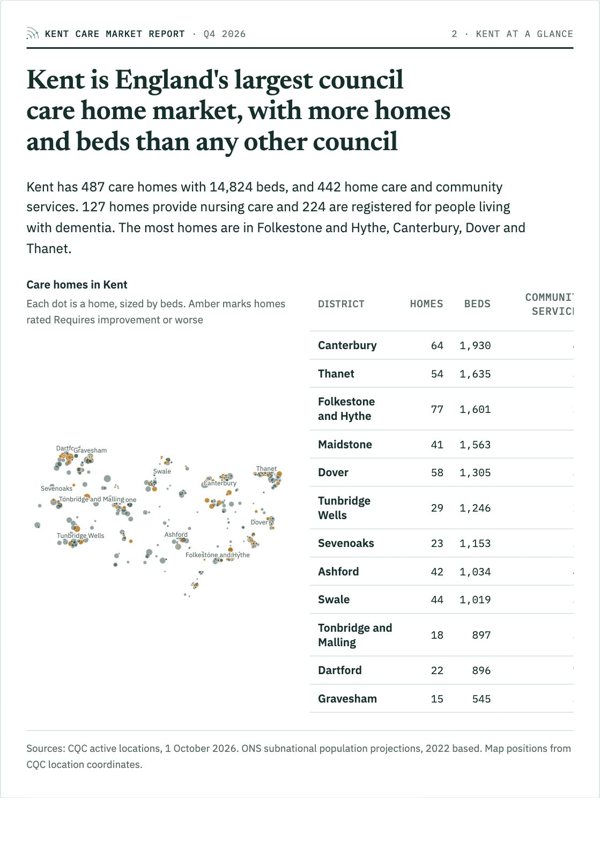
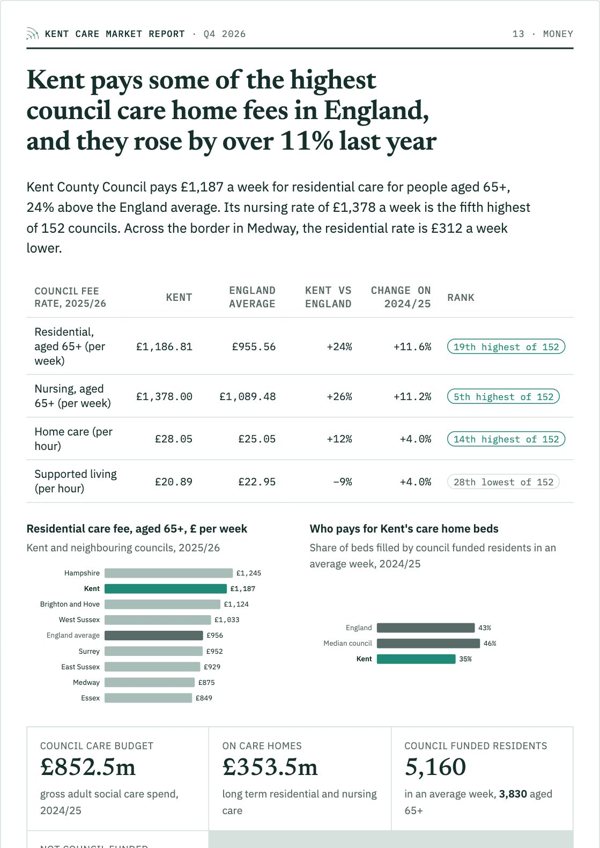
Everything we know about one council area in a single report: care homes, nursing homes and home care, demand to 2035, every district profiled, who owns what, what the council pays and what it plans next.
Made for the decision in front of you
Buyers and investors
Test a deal against the whole market: demand, supply, fees, occupancy, transactions and the risks that could change the numbers.
Lenders and advisers
Sourced, dated evidence for a credit paper or valuation, with trading benchmarks, market value and a 25 point risk assessment.
Operators planning growth
Compare districts side by side, see where beds and services are short, and read what the council says it wants to buy.
Councils and NHS teams
An independent view of the local market, with neighbouring councils, policy outlook and local plans in one place.
What you will know after reading it
Every answer is backed by sourced figures for the council and each of its districts, with a note on what it means for you.
- How many people will need care here by 2035, and is supply keeping pace?
- Which districts are short of beds or home care, and which are crowded?
- What does the council pay, what do self funders pay, and how big is the gap?
- Who owns the homes, who lends to them and who is changing hands?
- What are the biggest risks to the market over the next three years?
- What does the council plan to commission, and what will it stop buying?
Every section in the report
The big picture
- Executive summary
- The council at a glance
- Policy outlook
- Local plans
- Our view
Demand
- Demand to 2035
- Need by age (industry method)
- Care needs and dementia
- Dementia need and diagnosis gap
- Hospital discharge pressure
Supply and quality
- Care home supply
- Market standard supply
- Quality
- Risks to check
- Closure risk
Competition and ownership
- Competition
- Ownership
- Change and ownership
- Transactions and valuations
- Operator finances
Home care
- Home care and community services
- Home care value and price gap
Money
- Council fees
- Occupancy
- Market value
- Private fees
- Can self funders pay?
- How care homes get paid
- Indicative income per bed
- Trading benchmarks
Workforce and the council
- Workforce
- What the council wants
- Neighbouring councils
Every district
- Districts compared
- A profile of every district
Risk
- SWOT by sector
- Risk assessment: 25 risks rated
Reference
- Methods and sources
- Every care home listed
Choose your council
Kent
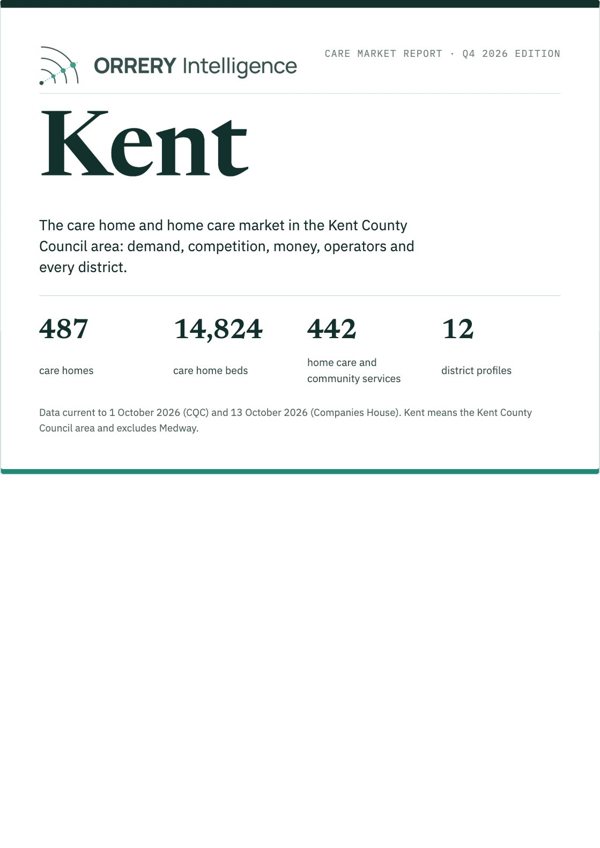
487 care homes · 14,824 beds · 442 home care and community services
West Sussex
332 care homes · 10,386 beds · 246 home care and community services
Another council?
Free headline figures for all 153 councils in England, and a note when your council's report is ready.
Which report is right for you?
| Included | Full market reports£295 | Care homes£195 | Nursing homes£195 | Home care£195 |
|---|---|---|---|---|
| Executive summary, policy outlook and local plans | ✓ | ✓ | ✓ | ✓ |
| Demand to 2035 | ✓ | ✓ | ✓ | ✓ |
| Dementia need and hospital discharge pressure | ✓ | ○ | ✓ | ✓ |
| Care home supply and quality | ✓ | ✓ | ✓ | ○ |
| Competition and changes of owner | ✓ | ✓ | ✓ | ○ |
| Council fees, private fees, occupancy and benchmarks | ✓ | ✓ | ✓ | ○ |
| Can self funders pay? | ✓ | ✓ | ○ | ○ |
| Home care rates and the price gap | ✓ | ○ | ○ | ✓ |
| Workforce and operator finances | ✓ | ○ | ✓ | ✓ |
| A profile of every district | ✓ | ○ | ○ | ○ |
| SWOT and rated risk assessment | 25 risks | 22 risks | 21 risks | 15 risks |
| Our view of the opportunities | ✓ | ○ | ○ | ○ |
| Directory | Every care home | Every care home | Every nursing home | Every home care service |
Before you buy
Anything else? Email hello@orreryintelligence.com and we reply within one working day.
Do I need the full report or a focused one?
Choose the full report if your decision touches more than one part of the market, or you want a profile of every district and our view of the opportunities. If you only work in care homes, nursing or home care, the £195 focused report for that sector may be all you need.
Can I use it with clients or lenders?
The standard licence covers you and colleagues in your organisation. Brokers, lenders and consultants who use it in client work should choose the adviser licence at £895 + VAT, which allows figures and charts with a credit.
Is there a version with live data?
Yes. Report plus live data (£395 + VAT) adds three months of live data for the council when it opens.
What do I receive?
Instant access to the web report and a PDF emailed to you, stamped with your name and order number. Your receipt and VAT invoice come by email straight after payment.
How up to date is it?
The Q4 2026 edition uses CQC data to 1 October 2026 and Companies House to 13 October 2026. If a new edition of your council comes out within 90 days of your purchase, you get it free.
My council is not ready yet. What can I do?
Every council already has free headline figures on its council page. Tell us which council you need there and we will email you once when its report is published.
Full market report, £295 + VAT
Ready now for Kent and West Sussex.
Choose your council