Investor screening regions and councils
Which councils combine growing demand, tight supply, decent fees and affordable land and buildings?
Rank councils on the measures that matter, then compare a shortlist side by side.
When people use it: Each year when setting investment priorities.
How it works, step by step
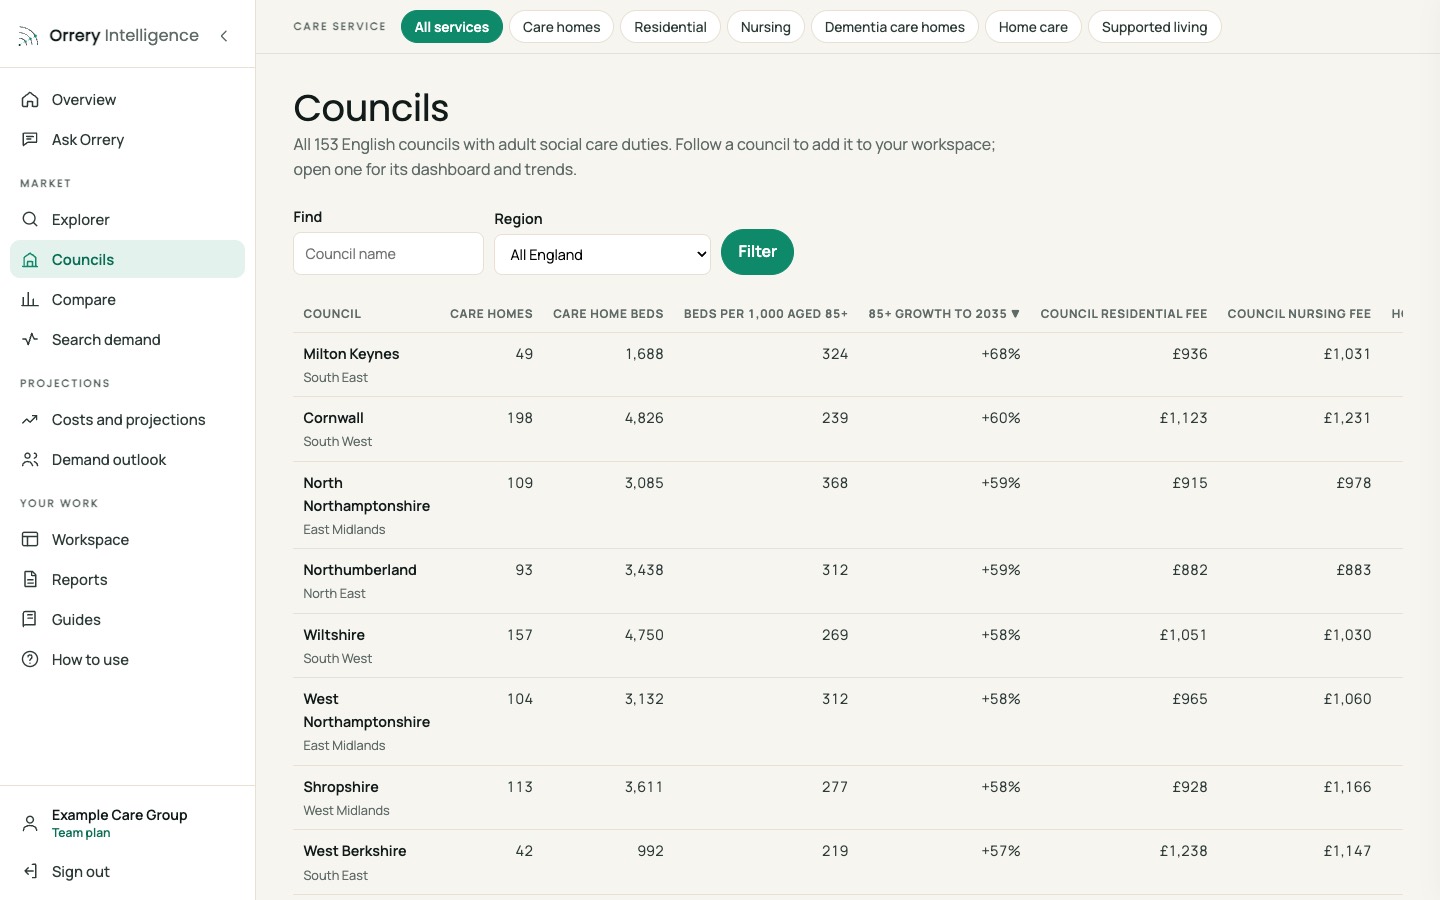
Rank the councils
Sort by 85+ growth, beds per 1,000 aged 85+, occupancy and fees; filter by region.
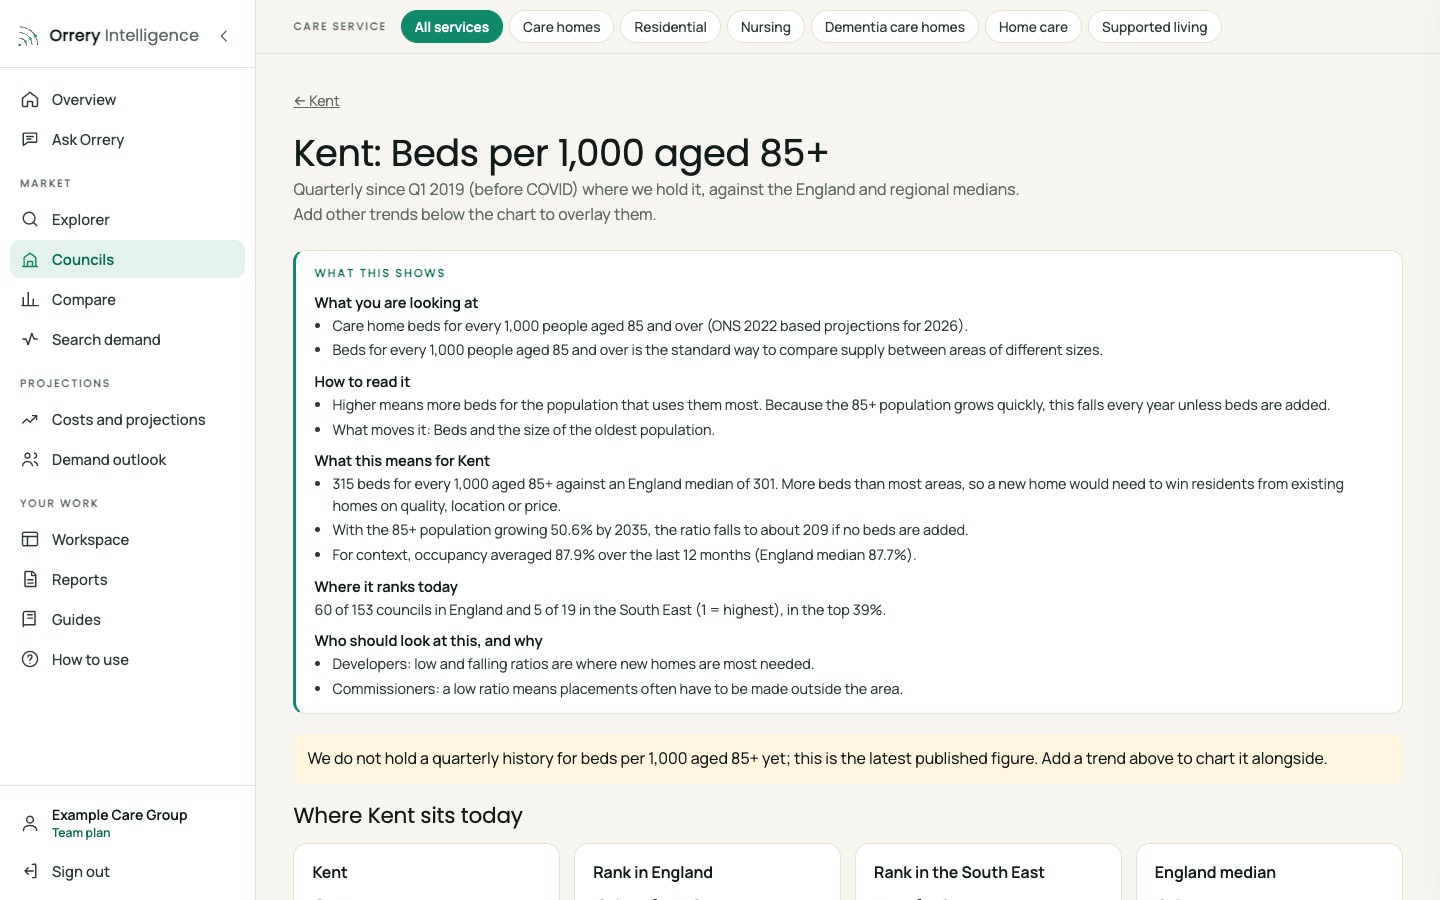
Where each sits
The England position strip shows the whole country at once; click any dot to jump to that council.
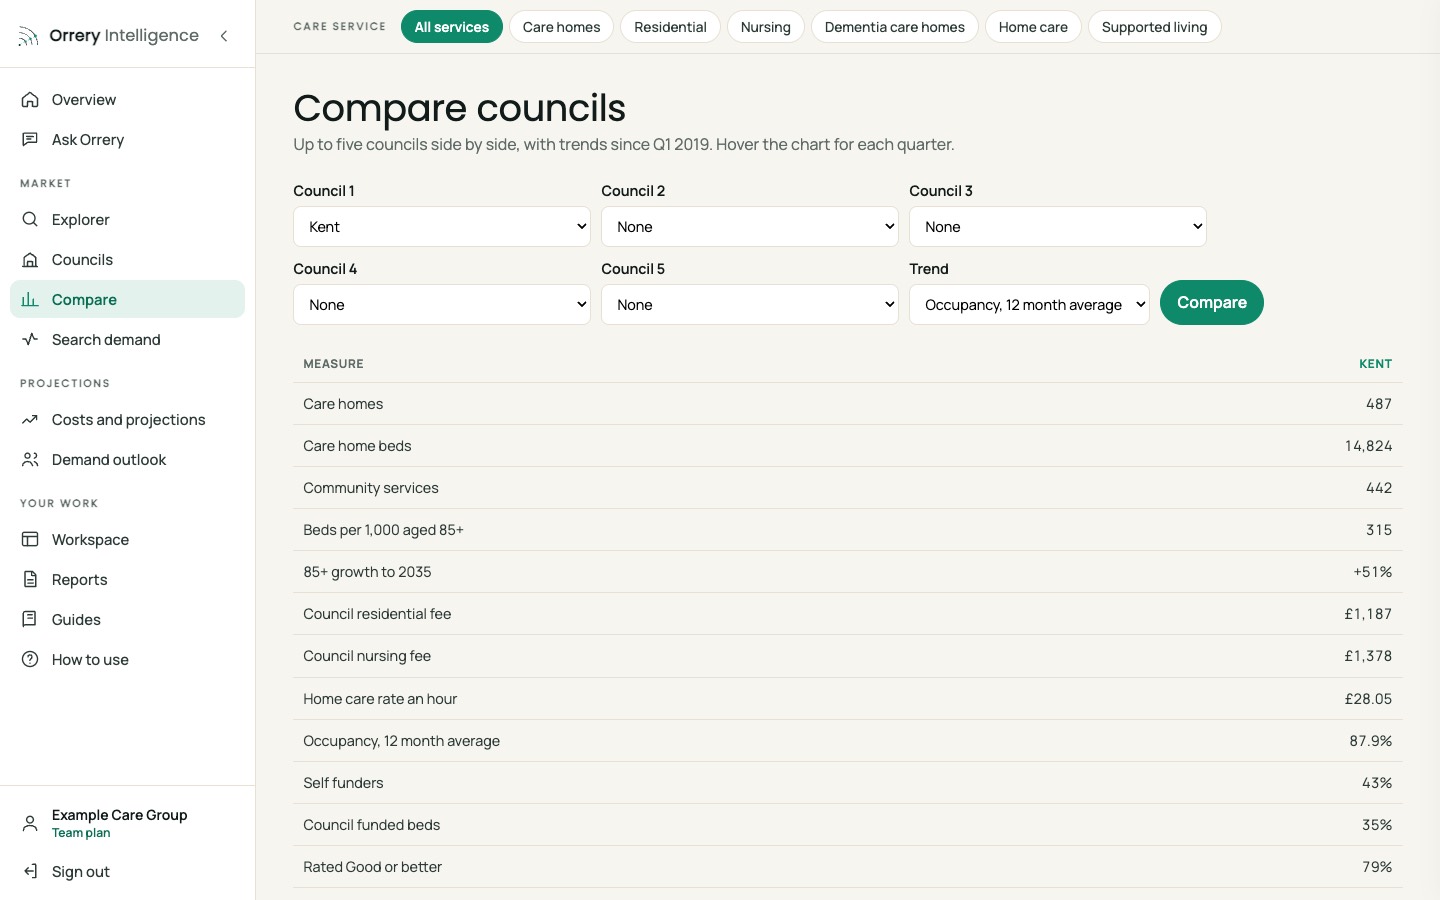
Shortlist side by side
Up to five councils; the commentary names the leader and the biggest mover.
Demand outlook for each
Which shortlisted councils move into shortage, and when?
Follow them
Follow your shortlist so it appears in your workspace.
The views you will use
Ask the data in plain English
A real question and answer from Ask Orrery, the assistant inside the platform, for a care home owner in Kent (October 2026). It answers only from Orrery's data and the subscriber's own documents, and shows its sources.
In the South East, the Isle of Wight is the only council in the top five on both measures.
Tightest occupancy (12 month average, Orrery council data; England median 87.7%):
- Reading 91.6%
- Isle of Wight 90.6%
- Portsmouth 90.0%
- Wokingham 89.3%
- Brighton and Hove 88.3%
Fastest 85+ growth to 2035 (England median +41%):
- Milton Keynes +68%
- West Berkshire +57%
- Isle of Wight +57%
- Oxfordshire +55%
- Bracknell Forest +54%
How to read it: High occupancy means few spare beds, which usually gives homes more pricing power. Fast 85+ growth points to more future demand. Where both are high, as on the Isle of Wight, the market is tight now and likely to stay under pressure. The growth figures are projections on stated assumptions, not forecasts.
- No single measure is enough: high growth with high supply and low fees is weaker than moderate growth with low supply and good fees.
Answer this for your own councils
Subscribers get every guide, chart and projection for all 153 councils, Ask Orrery, and every council report.
The Orrery platform opens to subscribers shortly. Register and we will tell you first.
Register for early access