Sickness absence patterns and their cost
How much sickness absence do we have, who has frequent short absences, and what does covering it cost?
Upload your sickness record and a payroll. Ask Orrery totals hours lost by month and role, finds frequent short absences, and costs the cover.
When people use it: Quarterly, and before return to work and absence reviews.
How it works, step by step
Upload the files
Hours or days both work; say which if the file does not.
Patterns
Frequent short absences disrupt rotas more than one long absence of the same length.
Cost of cover
Cover at overtime or agency rates is the real cost, not the sick pay.
What you upload
- Sickness absence by person and month (or a holiday file with a sickness section)
- A payroll with rates
Files are stored privately for your account, never shared with anyone and never used to train AI. You can delete them at any time. Spreadsheets, CSV, PDF and Word files all work, in your own layout.
Try it with sample files
Made up files for a made up provider, Example Care Group, so you can see what Ask Orrery does with them.
Questions you can ask
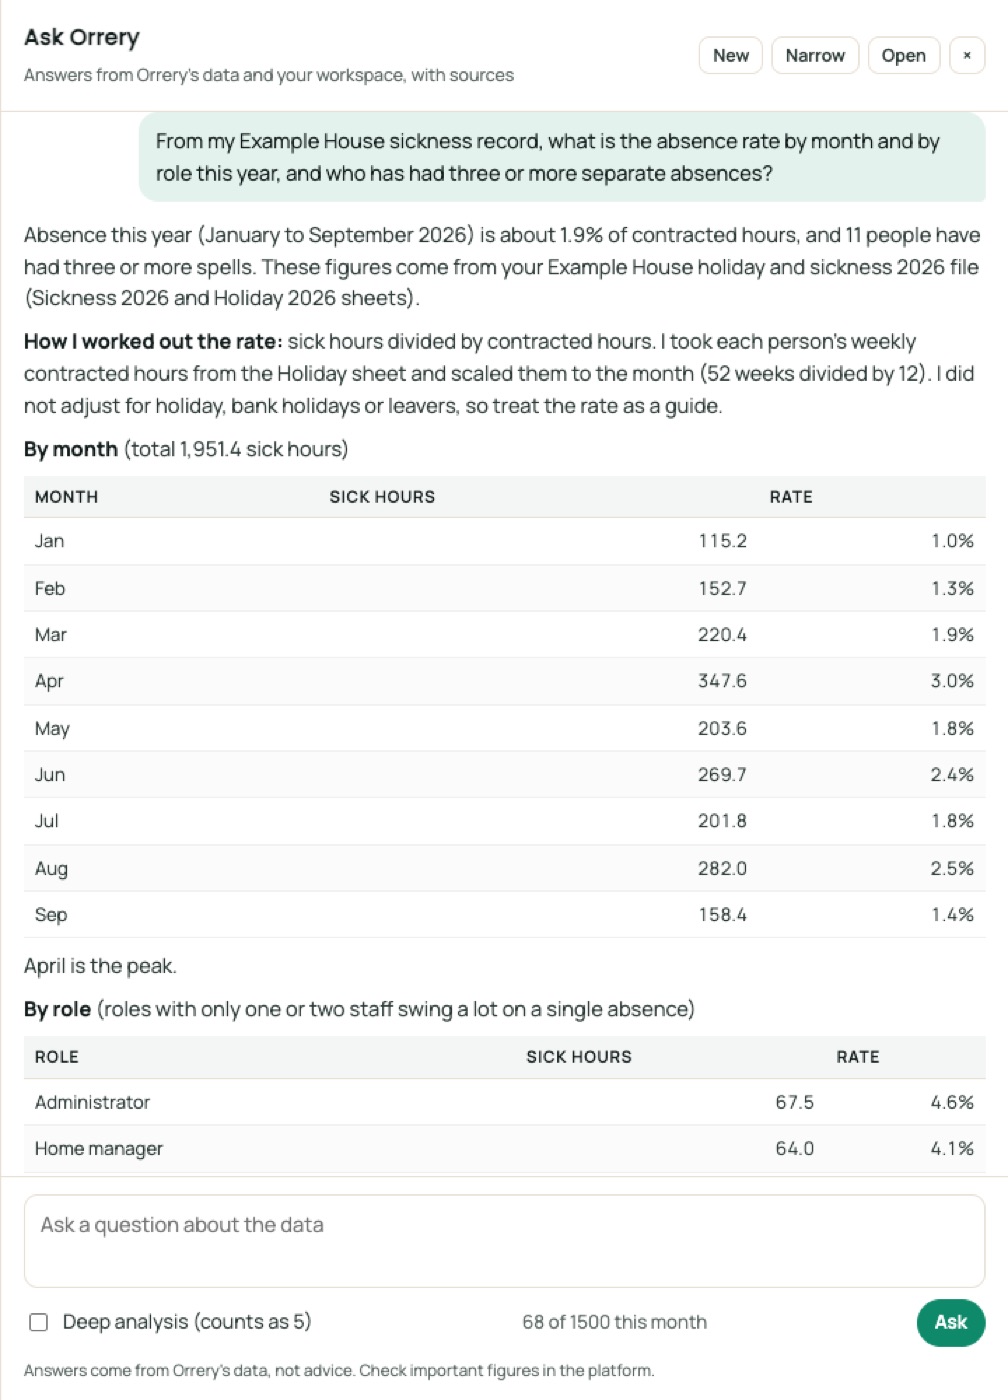
- “From my Example House sickness record, what is the absence rate by month and by role this year, and who has had three or more separate absences?”
- “What has covering sickness cost so far this year at overtime rates?”
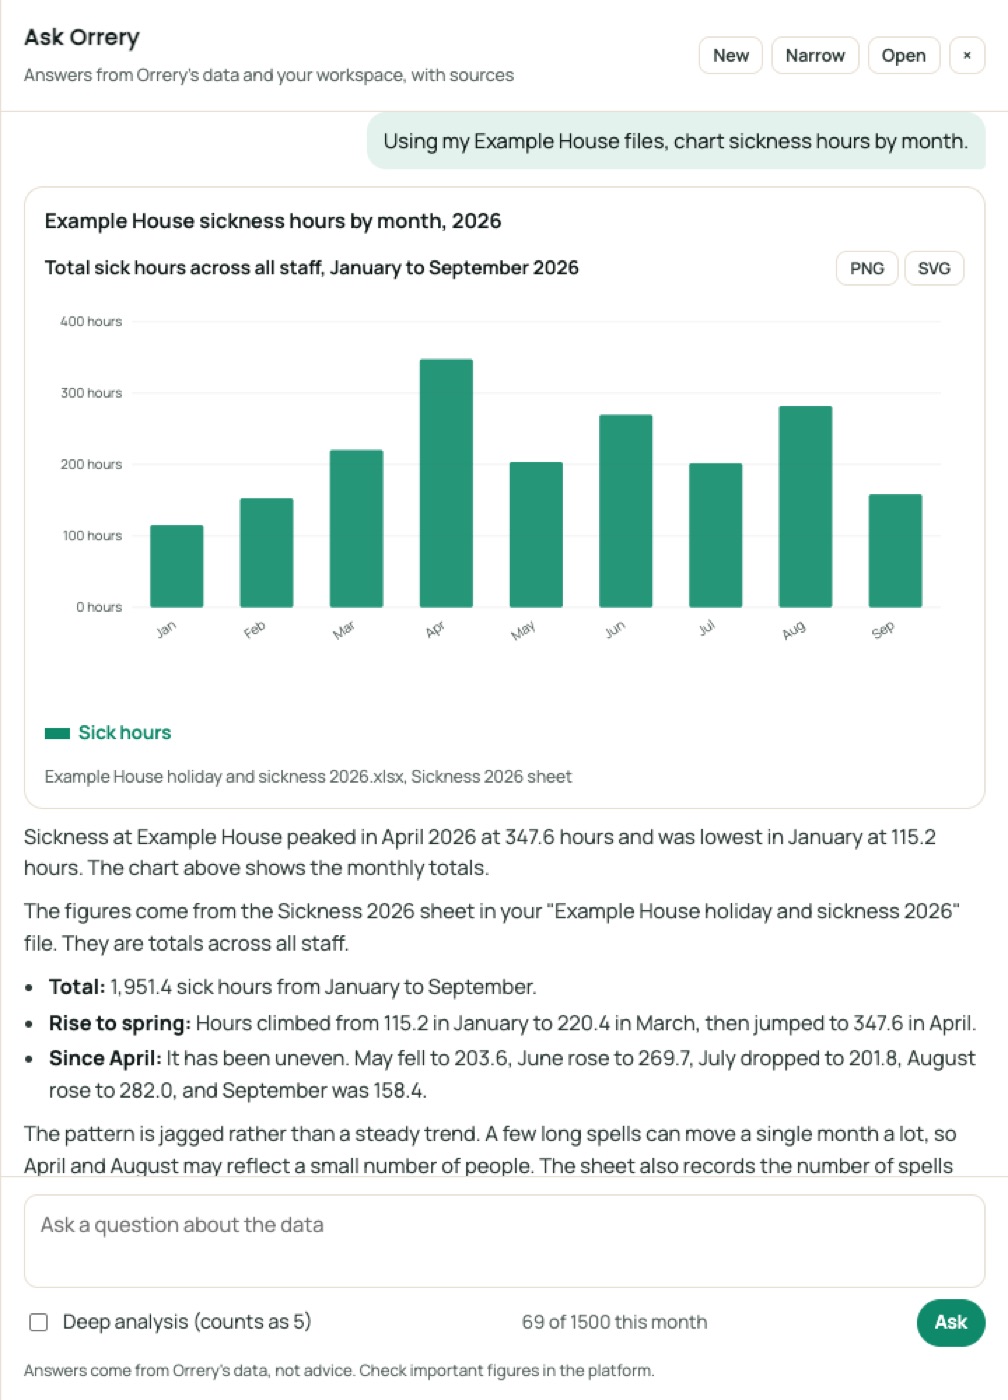
- “Chart sickness hours by month.”
Ask the data in plain English
A real question and answer from Ask Orrery, the assistant inside the platform, using the Example Care Group sample files above (October 2026). It works from your files and Orrery's data, and shows its sources.
The home's overall absence rate for January to September 2026 is 1.9%. That is 1,951.4 sick hours against about 102,900 contracted hours. Eleven people have had three or more separate spells.
I took the figures from your "Example House holiday and sickness 2026.xlsx". I worked out the rate as sick hours divided by contracted hours (the contracted weekly hours in the Holiday sheet, scaled by days in the month). It assumes everyone was employed all year.
By month
| Month | Sick hours | Rate |
|---|---|---|
| Jan | 115.2 | 1.0% |
| Feb | 152.7 | 1.4% |
| Mar | 220.4 | 1.9% |
| Apr | 347.6 | 3.1% |
| May | 203.6 | 1.7% |
| Jun | 269.7 | 2.4% |
| Jul | 201.8 | 1.7% |
| Aug | 282.0 | 2.4% |
| Sep | 158.4 | 1.4% |
By role (January to September)
| Role | Rate |
|---|---|
| Admin (1 person) | 4.6% |
| Home manager (1 person) | 4.1% |
| Activities coordinator (1 person) | 2.6% |
| Housekeepers | 2.3% |
| Care assistants | 2.2% |
| Nurses | 2.0% |
| Senior carers | 1.2% |
| Kitchen assistants | 0.4% |
| Cooks | 0.3% |
| Deputy manager (1 person) | 0.5% |
| Maintenance (1 person) | 0.5% |
| Laundry assistants | 0% |
Single-person roles swing a lot on one absence.
Three or more separate spells
- Sita Fox, Nurse: 6 spells, 144 hours
- Isaac Okafor, Care assistant: 6 spells, 108 hours
- Ines Evans, Care assistant: 5 spells, 64 hours
- Rosa Varghese, Nurse: 4 spells, 33.6 hours
- Liam Yeboah, Care assistant: 4 spells, 62.4 hours
- Cole Evans, Care assistant: 4 spells, 50.4 hours
- Dina Thomas, Care assistant: 3 spells, 43.2 hours
- Sam Vaughan, Care assistant: 3 spells, 79.2 hours
- Nia Doyle, Care assistant: 3 spells, 80 hours
- Tia Novak, Care assistant: 3 spells, 48 hours
- Dee Mills, Administrator: 3 spells, 67.5 hours
The spell counts come from the file's "Spells" column. They match the number of months with absence for the people I checked, so I can't tell whether a month held more than one spell.
Frequent short absences are often reviewed against your own sickness policy, and this is sensitive health data. Take HR advice before acting on it.
Orrery's "sickness-cost" guide can price this absence if you want that next.
Ask, chart and report, in plain English
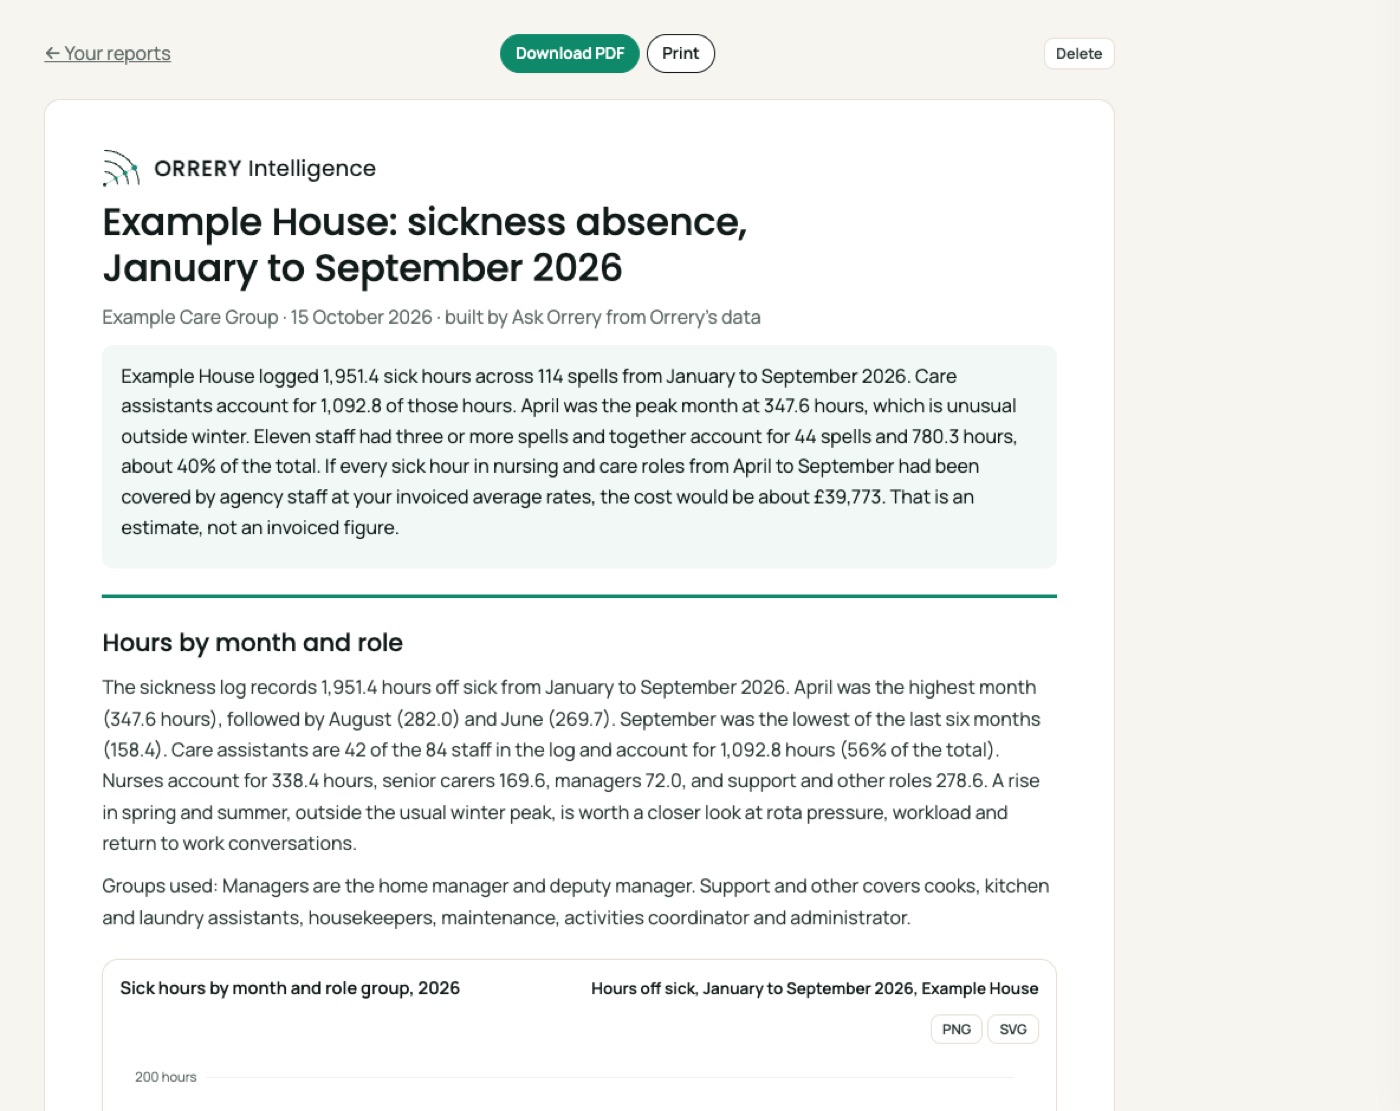
Ask Orrery answers from Orrery's data and your own files, draws charts on request and builds reports you can save as PDF. These are real examples made with the sample files.
- Treat the results as a prompt for supportive conversations, not a judgement: the file shows hours, not reasons.
- Winter peaks are normal; a rise outside winter is worth a closer look.
Answer this with your own files
Subscribers get every guide, chart and projection for all 153 councils, Ask Orrery with private uploads of their own files, and every council report.
The Orrery platform opens to subscribers shortly. Register and we will tell you first.
Register for early access