Competition and Ownership Intelligence
Understand who you are up against: how concentrated the market is, the largest operators, where owners are based, which homes have changed hands and what buyers are paying nationally.
Get the full picture
Size up the field
How many operators, and how much of the market the largest hold.
Know the owners
Charities, councils, local owners and groups based elsewhere.
Track the changes
Homes that changed owner or are part way through a change.
Read the deal market
National transaction and valuation evidence alongside local activity.
What you get, page by page
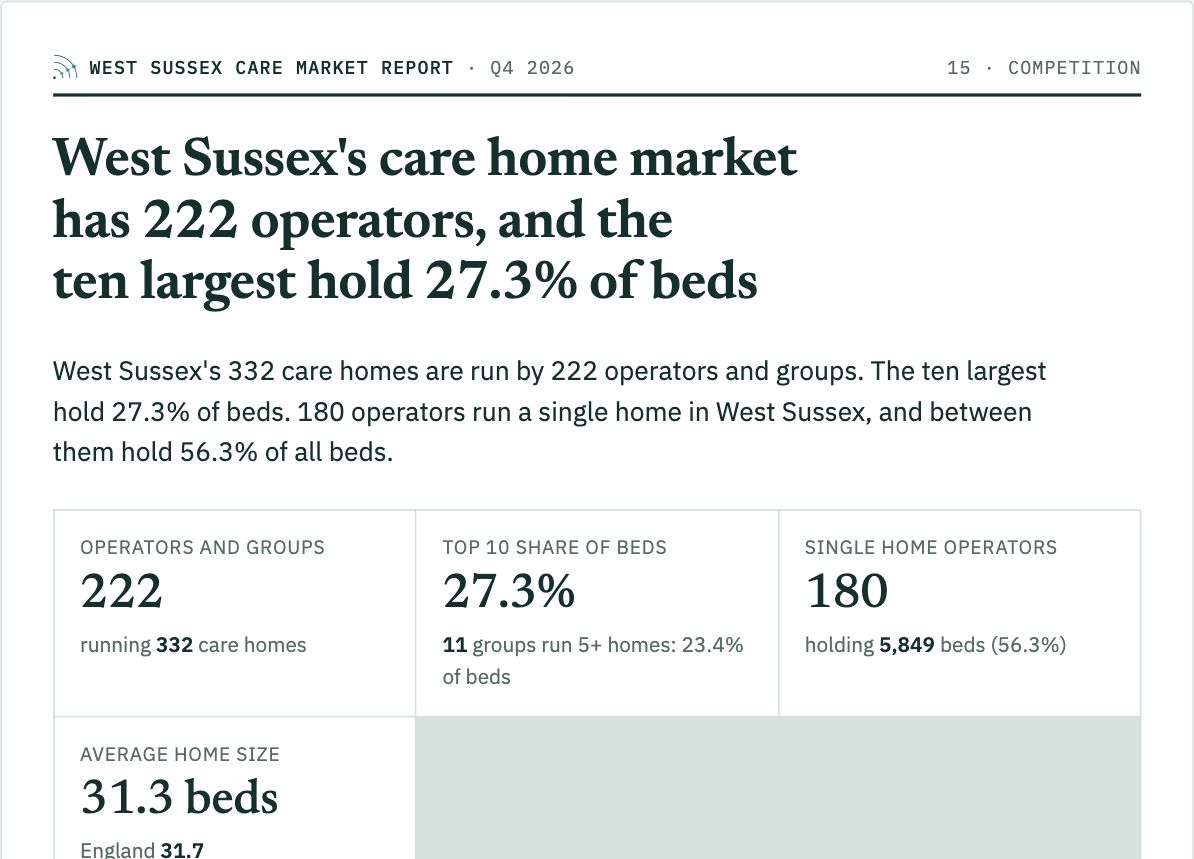
Competition
Operators and groups ranked by beds, the share held by the ten largest and the beds held by single home owners.
West Sussex report, Competition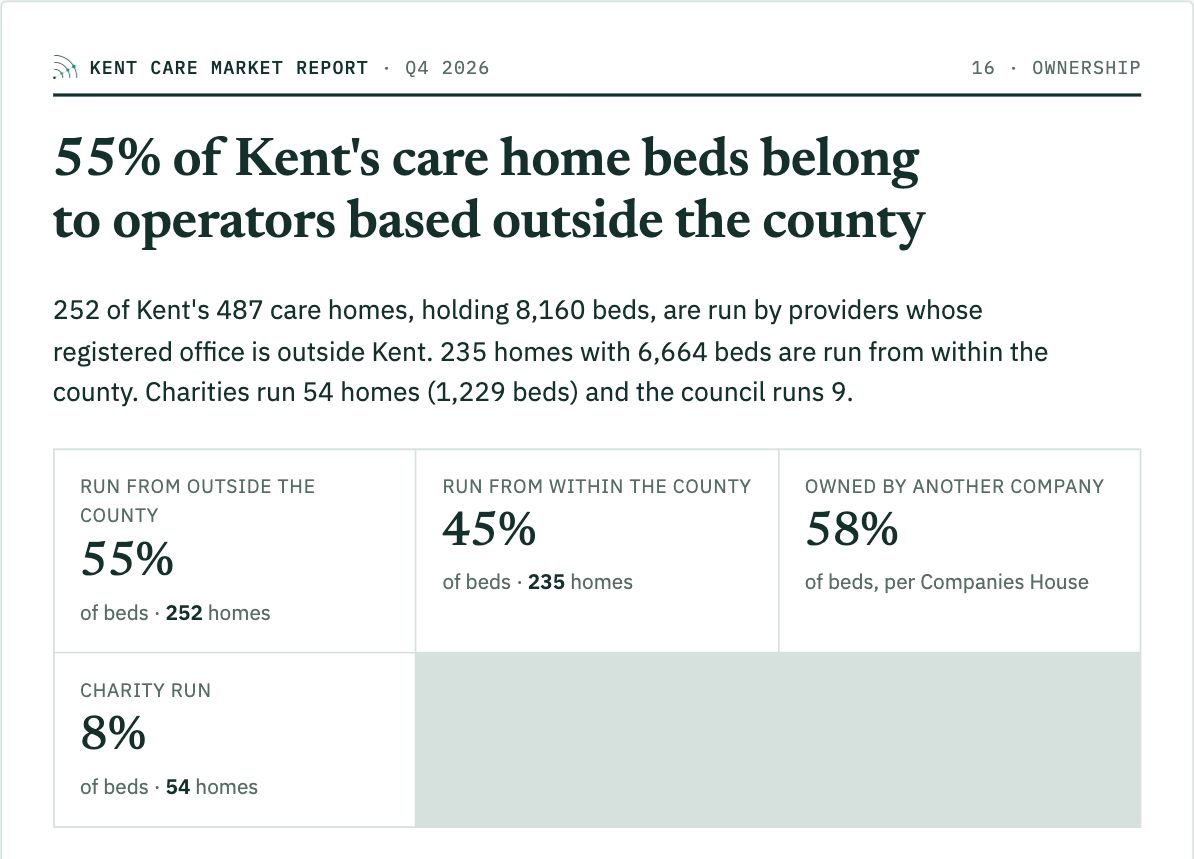
Ownership
Where operators are based, how many beds are run from outside the area, and what charities and the council run.
Kent report, Ownership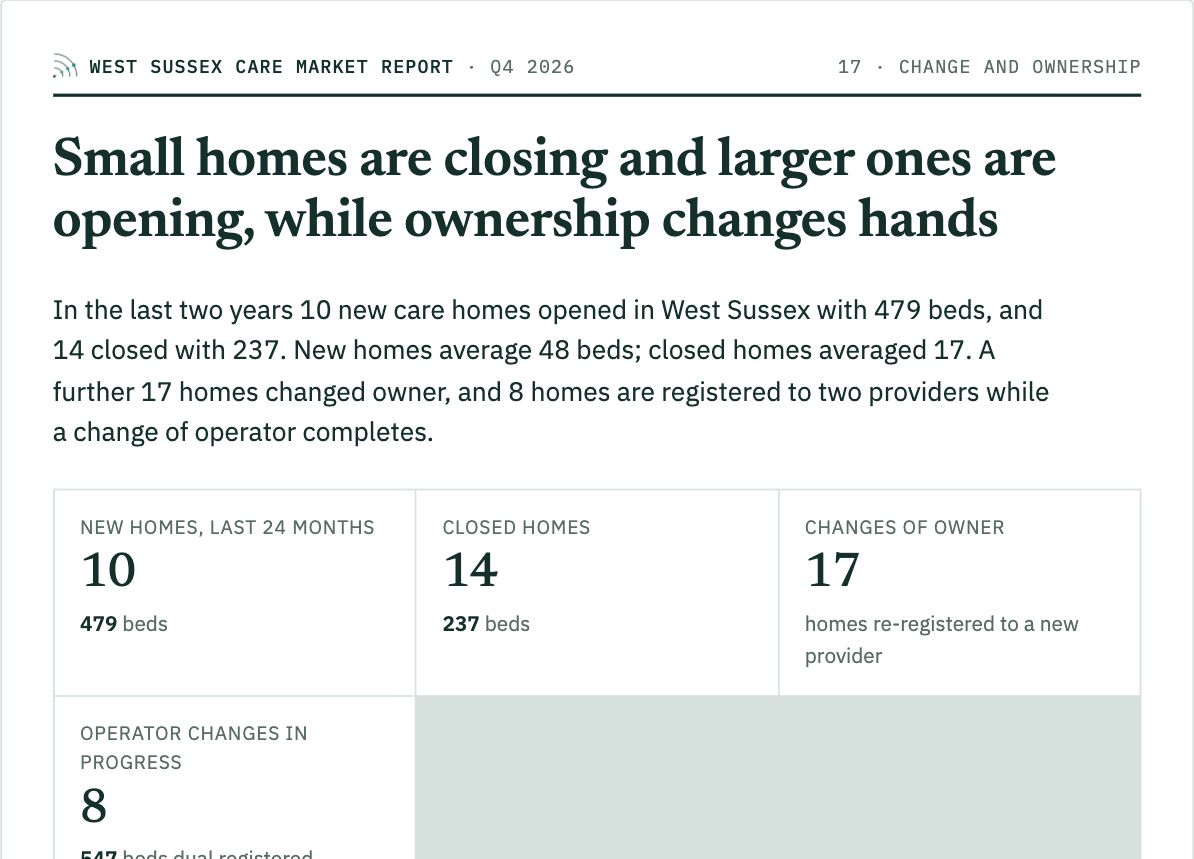
Change and ownership
New homes and closures with their size, and changes of operator that have happened or are in progress.
West Sussex report, Change and ownership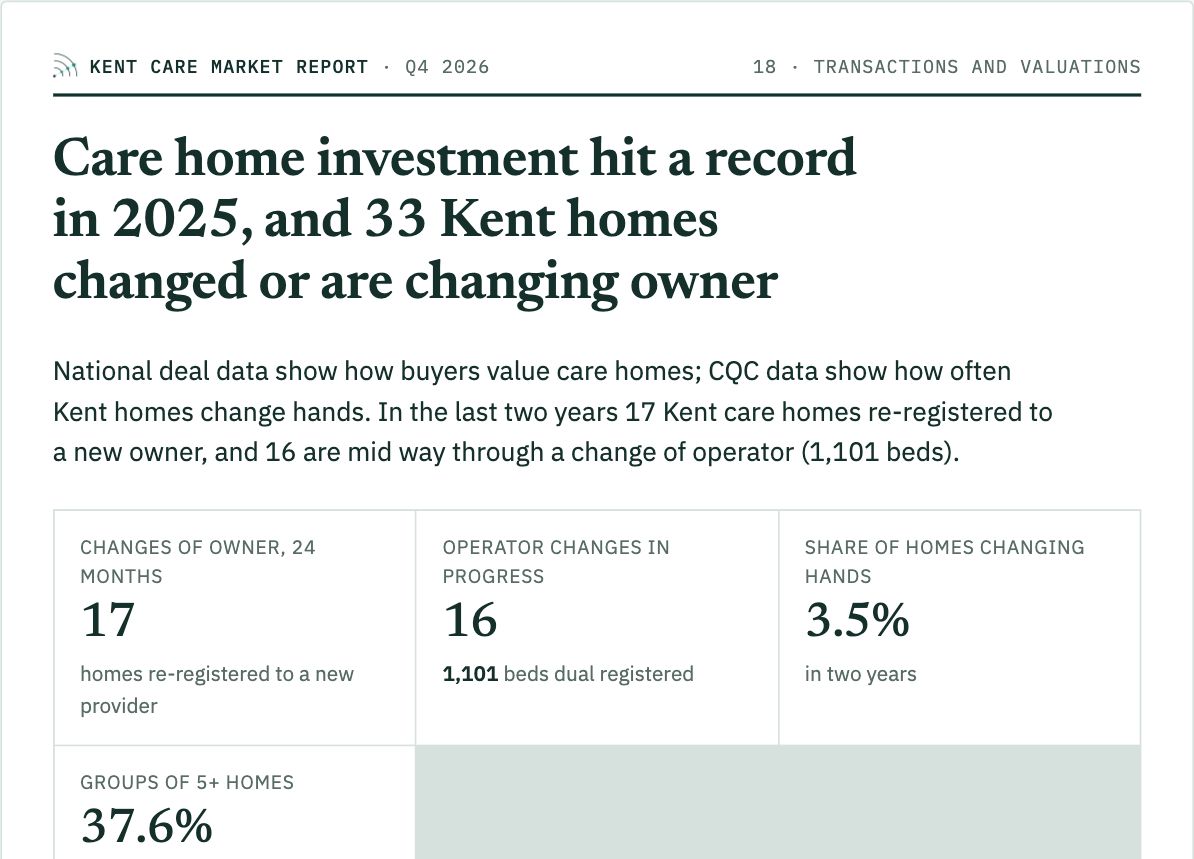
Transactions and valuations
National deal and valuation evidence set against how often homes in the area change hands.
Kent report, Transactions and valuationsEvery figure sourced and dated
Built from CQC, ONS, DHSC, NHS England, Companies House and council publications, refreshed every quarter.
- Operators and groups by beds
- Market share of the ten largest
- Single home operators
- Where owners are based
- Charity and council homes
- Changes of owner, done and in progress
- New homes and closures
- National deal evidence
Made for the decision in front of you
Acquirers
Find owners, spot homes changing hands and see who else is buying.
Brokers and advisers
Describe the market and the competition for a client or a sale.
Operators
Know which groups are growing in your area and where you stand.
One report, six kinds of intelligence
All six in one full market report
£295 + VAT per council, or £195 + VAT for a report on care homes, nursing homes or home care.