Payroll trend over several months
How have hours, overtime and wages moved month by month, and is anything drifting?
Upload several months of payroll. Ask Orrery lines them up, shows hours, overtime, holiday and gross pay by month and role, and explains the biggest changes against occupancy.
When people use it: Monthly or quarterly, for management meetings.
How it works, step by step
Upload the months
Upload all the months at once; Ask Orrery reads the month from each file name or title.
Line them up
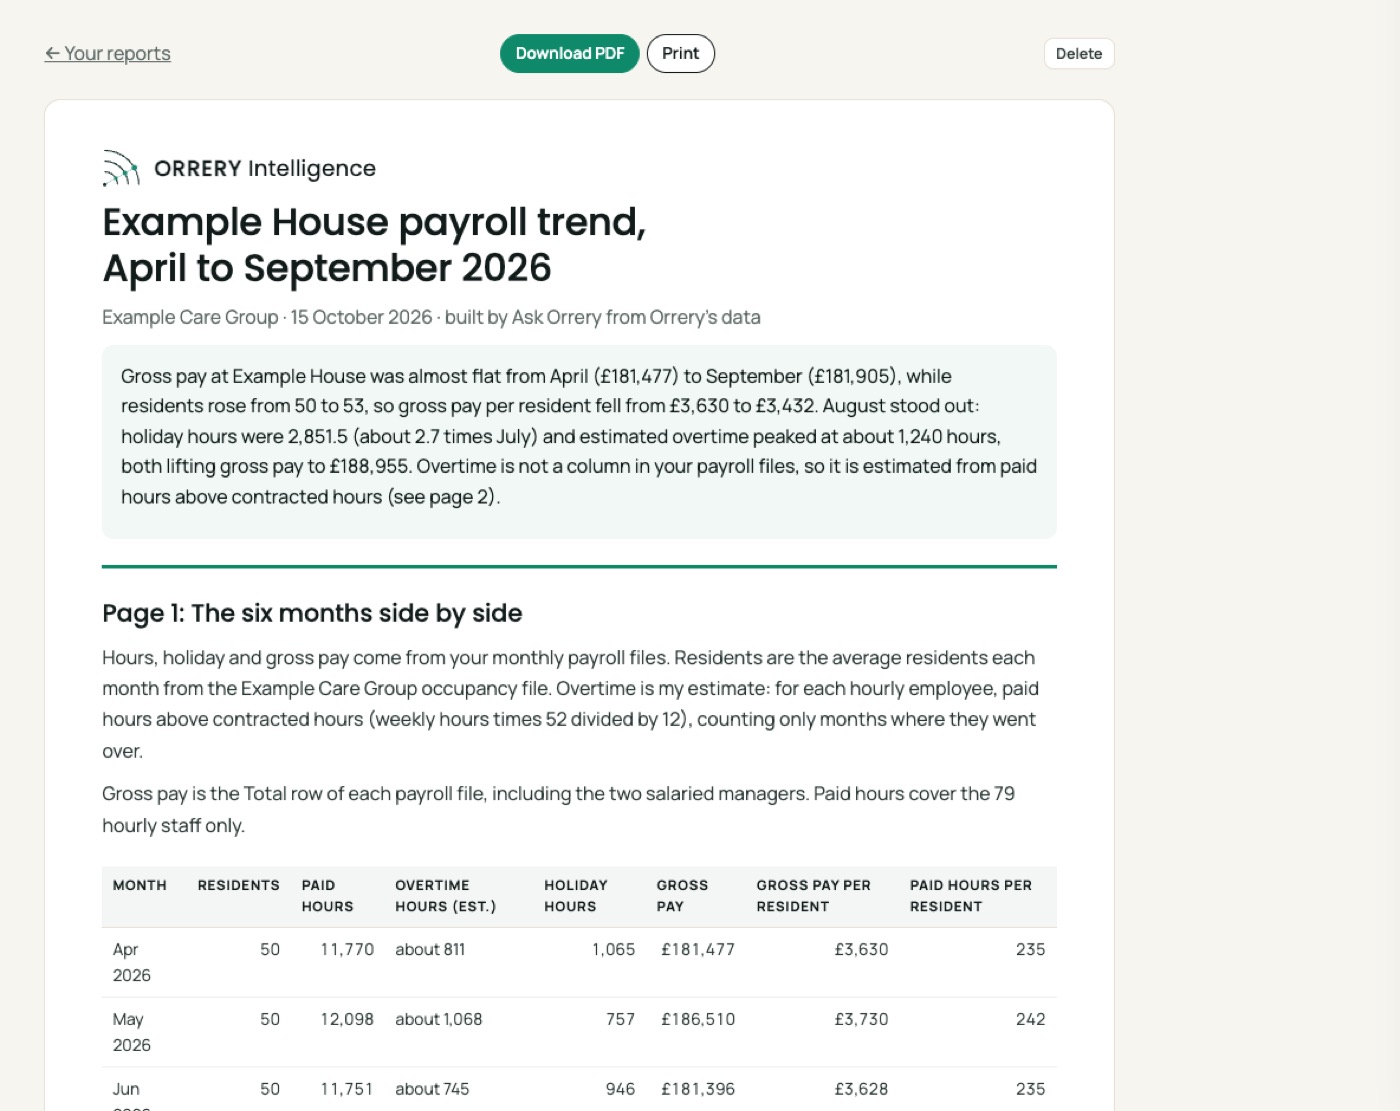
Pay per resident is the number to watch: pay rising faster than residents means hours are drifting up.
The market alongside
Is your occupancy following the local market or moving away from it?
What you upload
- Payroll for each month you want to compare
- Optionally, occupancy by month
Files are stored privately for your account, never shared with anyone and never used to train AI. You can delete them at any time. Spreadsheets, CSV, PDF and Word files all work, in your own layout.
Try it with sample files
Made up files for a made up provider, Example Care Group, so you can see what Ask Orrery does with them.
Questions you can ask
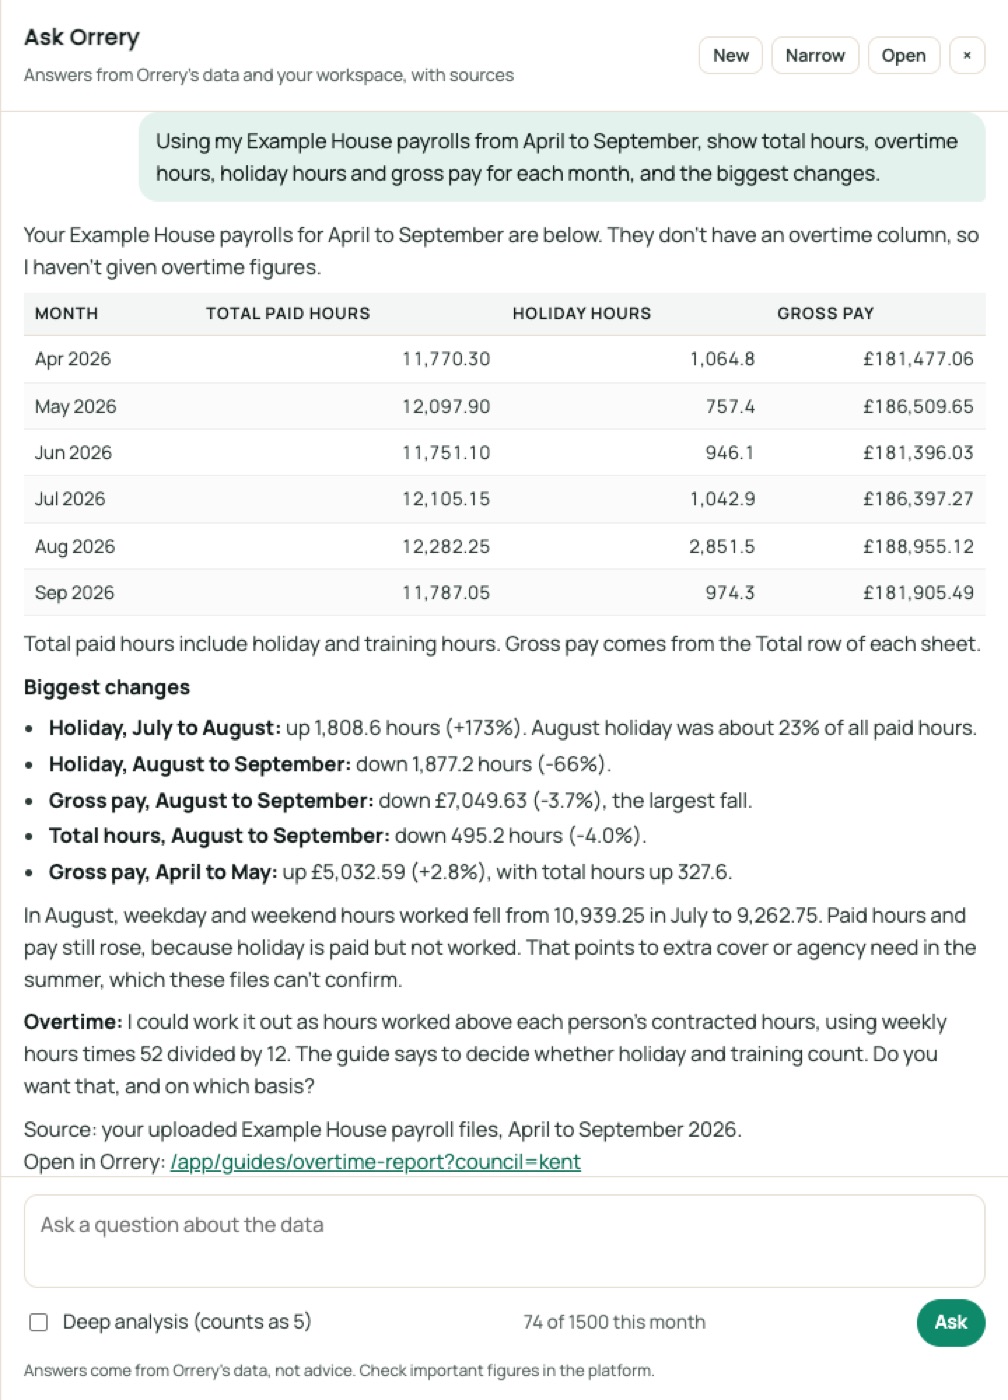
- “Using my Example House payrolls from April to September, show total hours, overtime hours, holiday hours and gross pay for each month, and the biggest changes.”
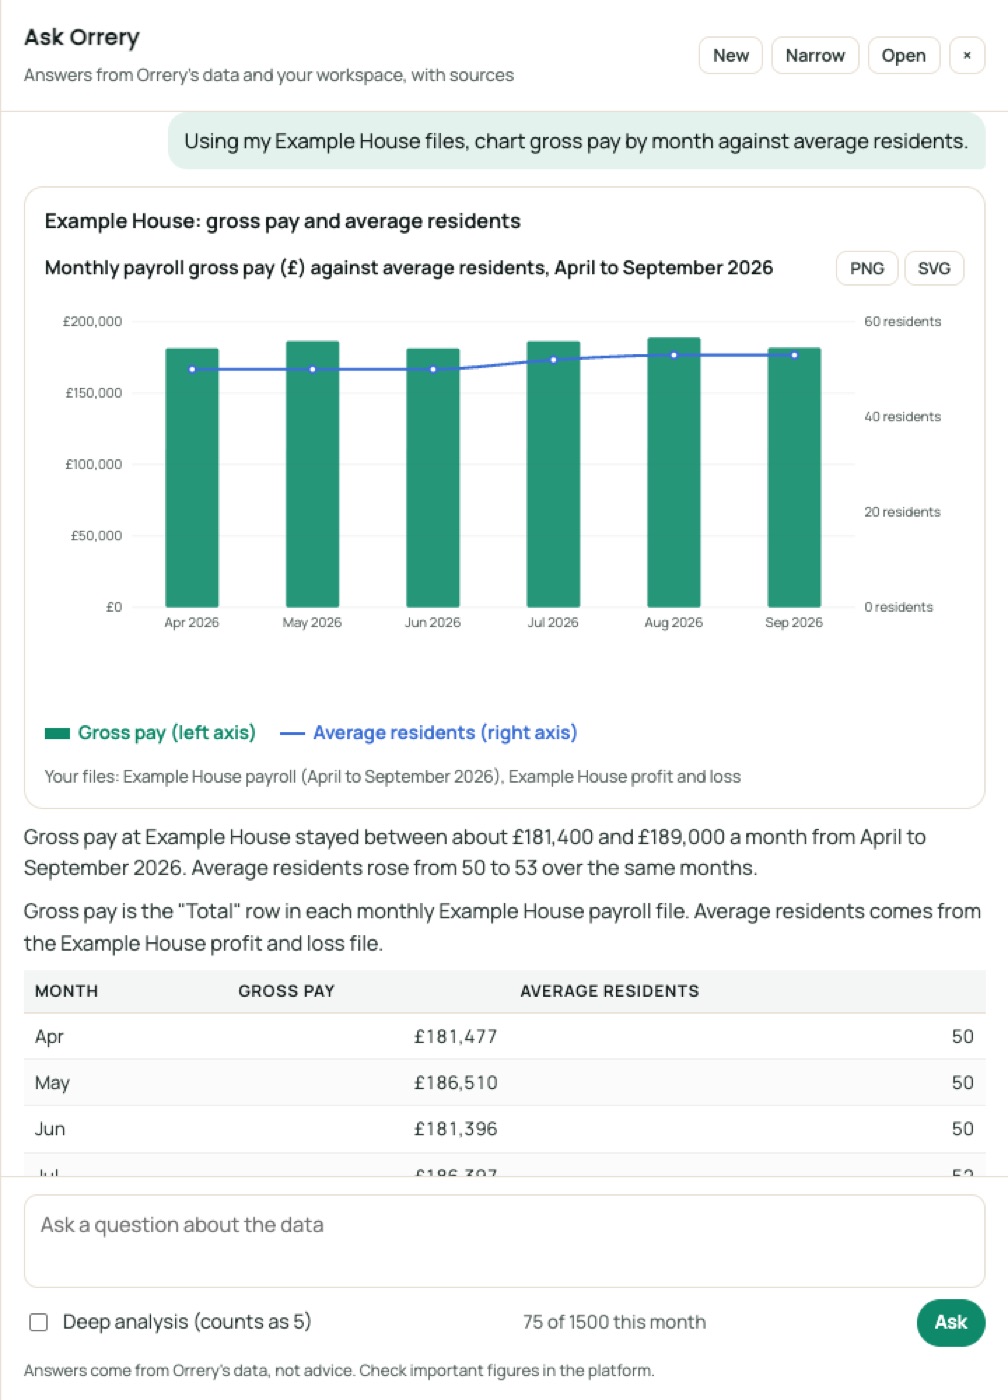
- “Chart gross pay by month against average residents.”
- “Which people's hours changed most over the six months?”
Ask the data in plain English
A real question and answer from Ask Orrery, the assistant inside the platform, using the Example Care Group sample files above (October 2026). It works from your files and Orrery's data, and shows its sources.
Gross pay and paid hours were fairly flat from April to September. Holiday hours and overtime moved a lot, and August was the outlier.
Your payroll has no overtime column, so I worked it out. Overtime here is weekday plus weekend hours worked above contracted hours (weekly hours × 52 ÷ 12), counted per person where positive. Holiday, training and sick hours are not counted as worked. The overtime figures are my own sums, so treat them as approximate.
| Month | Total paid hours | Overtime hours (approx.) | Holiday hours | Gross pay |
|---|---|---|---|---|
| Apr | 11,770.3 | 527 | 1,064.8 | £181,477.06 |
| May | 12,097.9 | 820 | 757.4 | £186,509.65 |
| Jun | 11,751.1 | 504 | 946.1 | £181,396.03 |
| Jul | 12,105.2 | 752 | 1,042.9 | £186,397.27 |
| Aug | 12,282.3 | 396 | 2,851.5 | £188,955.12 |
| Sep | 11,787.1 | 559 | 974.3 | £181,905.49 |
Biggest changes
- Holiday hours: they rose from 1,042.9 in July to 2,851.5 in August (+1,808.6), then fell back to 974.3 in September.
- Worked hours: they dropped from 10,939 in July to 9,263 in August, because of that holiday. Paid hours still rose, as holiday is paid.
- Overtime: it peaked in May (about 820, up about 293 on April) and was lowest in August (about 396, down about 356 on July).
- Gross pay: it was highest in August (+£2,558 on July) and fell £7,050 (3.7%) in September.
- Sick hours: they roughly doubled from 96.8 in August to 190.4 in September.
What it means: a few part-time staff (E106, E142, E152) work well above their contracted hours every month. That usually points to unfilled posts rather than one-off cover.
The home manager and deputy are salaried, with no hours recorded. Their pay is in gross pay but not in the hours.
My guide covers this: Open in Orrery: /app/guides/overtime-report?council=kent
I can chart these or save them as a report if you want.
Source: your Example House payroll files, April to September 2026.
Ask, chart and report, in plain English
Ask Orrery answers from Orrery's data and your own files, draws charts on request and builds reports you can save as PDF. These are real examples made with the sample files.
- Months have different numbers of days and weekends; compare pay per day or per resident as well as totals.
- August and December usually carry more holiday and overtime.
Answer this with your own files
Subscribers get every guide, chart and projection for all 153 councils, Ask Orrery with private uploads of their own files, and every council report.
The Orrery platform opens to subscribers shortly. Register and we will tell you first.
Register for early access