Care market evidence for lenders and advisers
Sourced, dated evidence of demand, fees, funding mix and operator finances for one council area, ready to cite in a credit paper, a valuation or a client report.
The evidence for the decision in front of you
Test the demand behind the deal
Growth in people aged 85+, beds needed by 2035, occupancy against England and how much new supply is coming.
Check the income line
Council and private fees, payer mix, Funded Nursing Care and EBITDARM for a typical home, tested three ways.
See the downside
A rated risk assessment, closure risk, and margins under low, central and high assumptions to 2031.
Cite it with confidence
Every figure carries a numbered reference to an official or published source, with the date, so your committee can check it.
An example from the Kent report
From the Q4 2026 Kent full market report. Every figure in the report is referenced to its source.
The pages you will use most
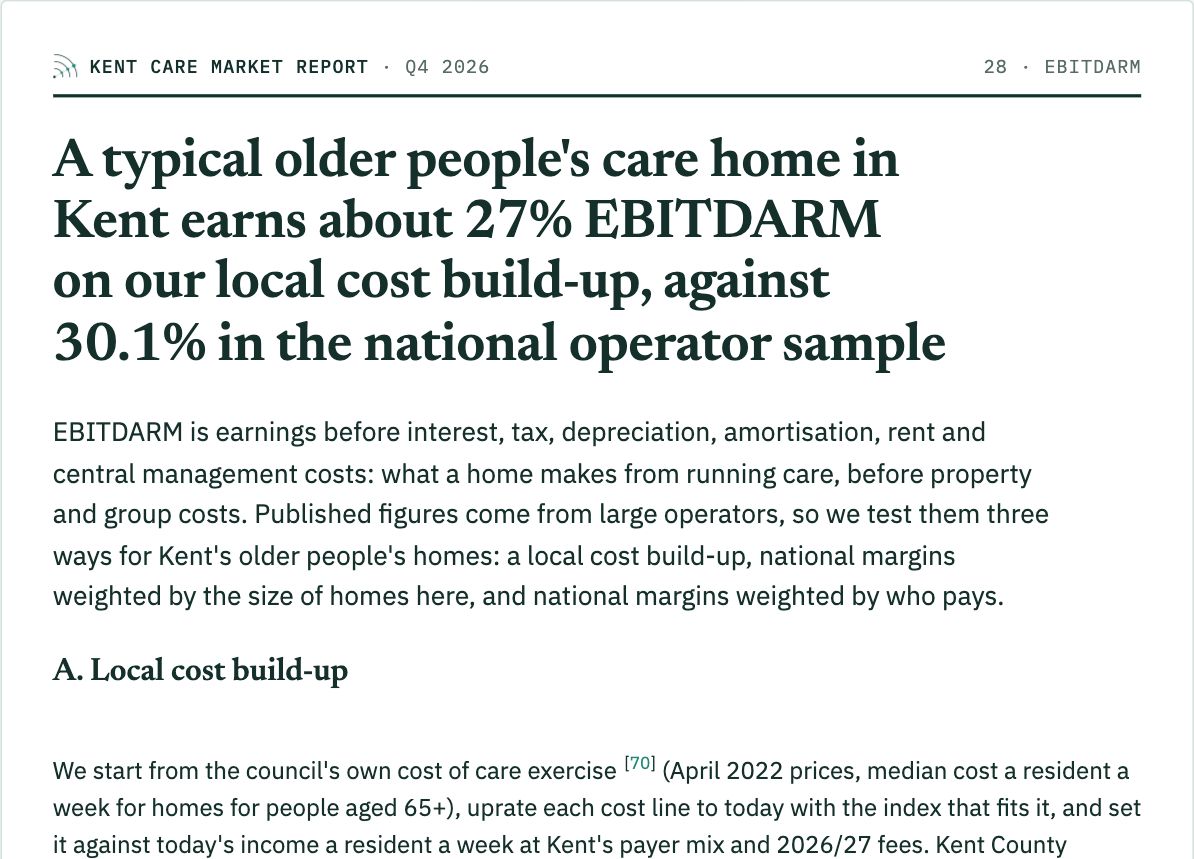
EBITDARM, tested three ways
A local cost build-up from the council's own cost of care exercise, uprated line by line, against national margins weighted by home size and by payer mix.
Kent report, EBITDARM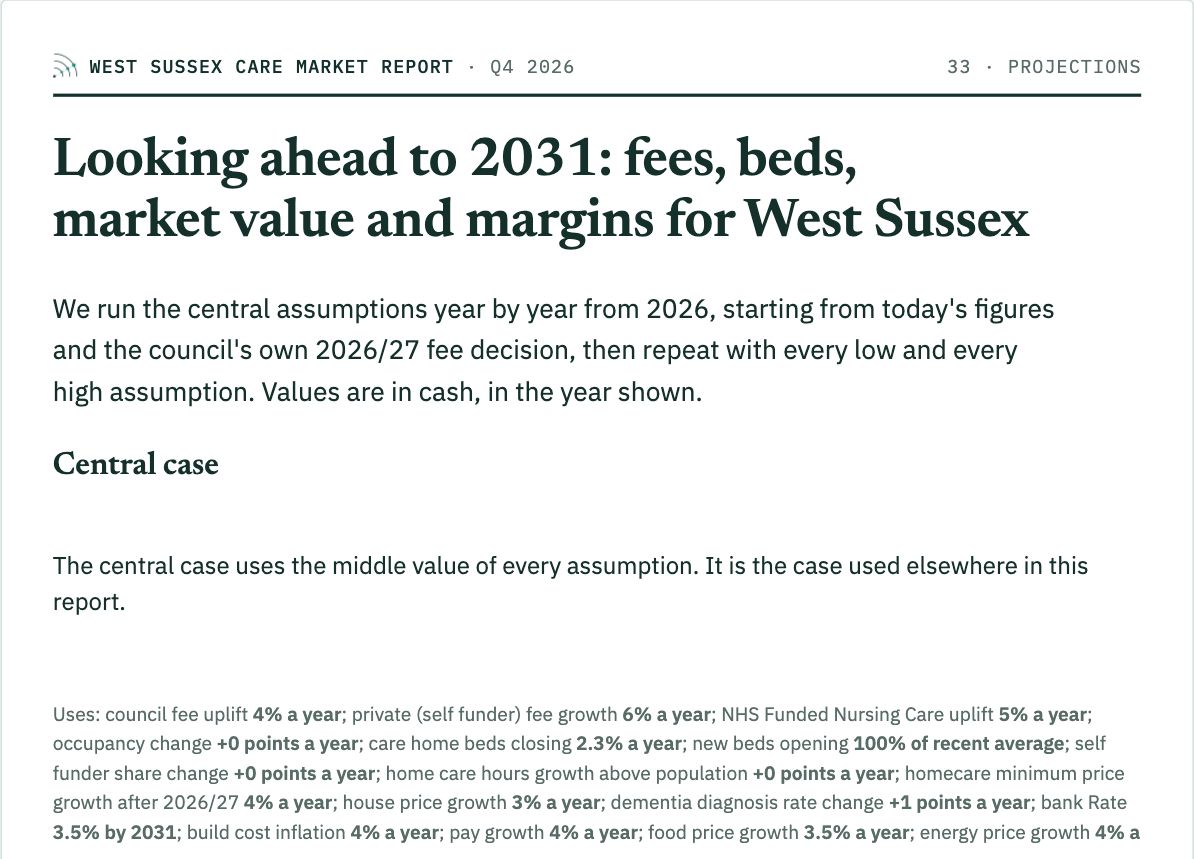
Projections and sensitivity to 2031
Fees, beds, market value and margins year by year, with a grid of margins for every pairing of fee rises and pay growth.
West Sussex report, Projections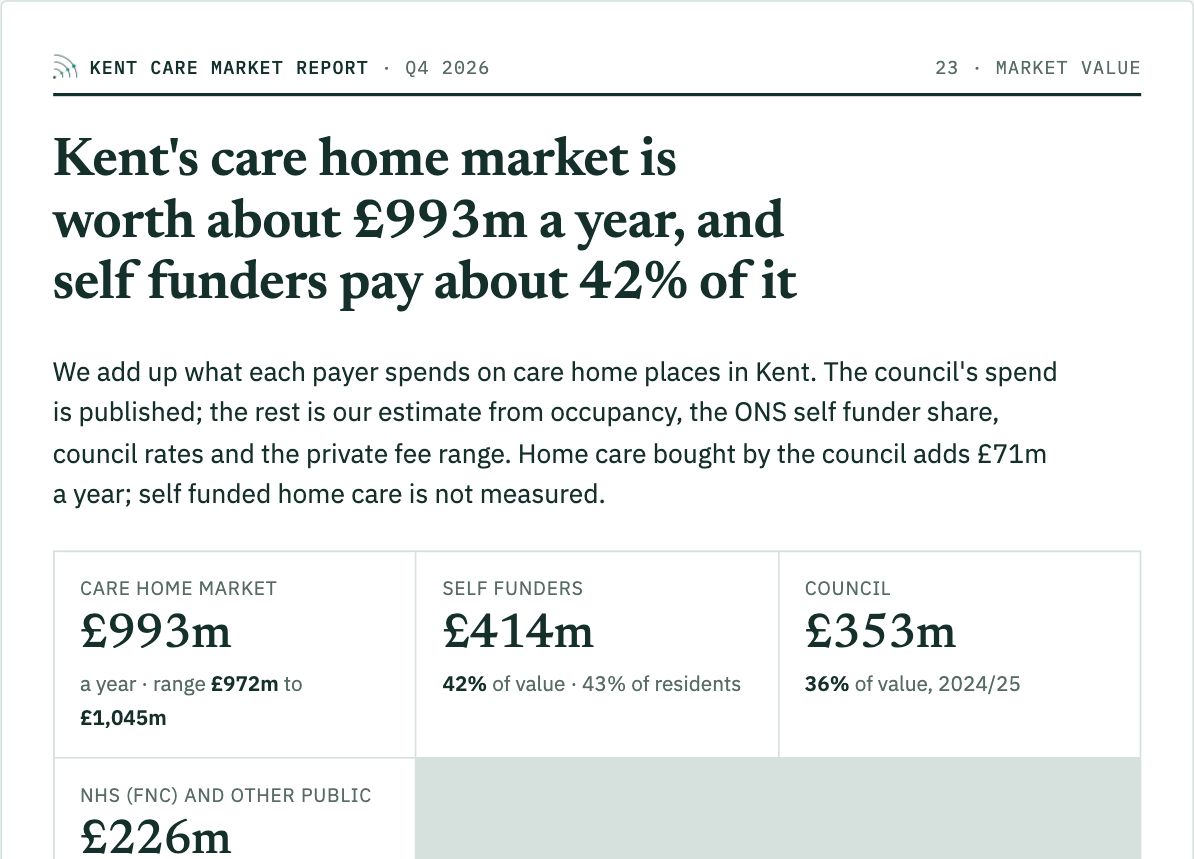
Market value by payer
What councils, self funders and the NHS spend on care homes in the area each year, as a low, central and high range.
Kent report, Market value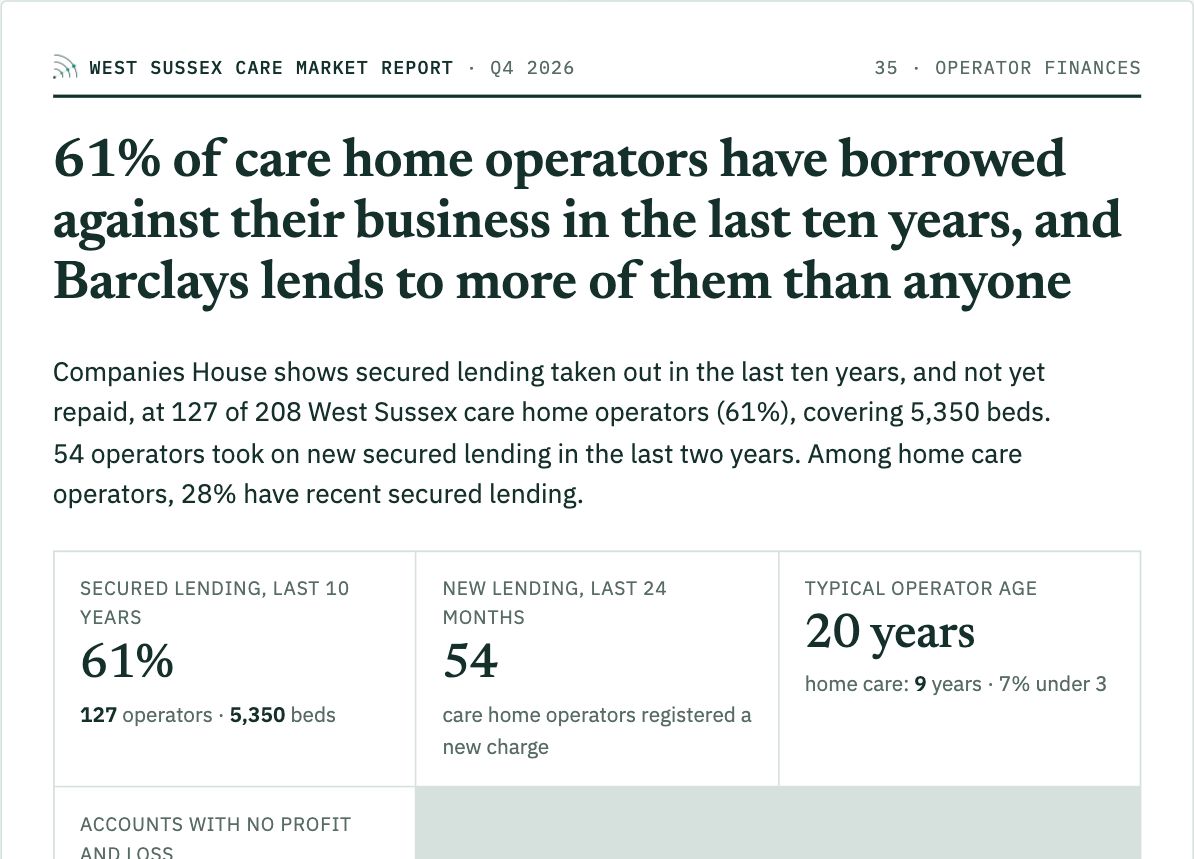
Operator finances
How many operators have borrowed against their business, who lends to them, and how recent the borrowing is.
West Sussex report, Operator financesThe adviser licence
For banks, brokers, valuers, consultants and accountants who use the evidence in client work.
- Everyone in your firm can use the report
- Quote figures and use charts in client work, with a credit to Orrery Intelligence
- Web report and a PDF stamped to your firm
- A free new edition if one is published within 90 days
Before you buy
Anything else? Email hello@orreryintelligence.com and we reply within one working day.
Can I quote the figures in a credit paper or valuation?
Yes, with the adviser licence. It lets everyone in your firm use figures and charts in client work, as long as Orrery Intelligence is credited. You may not publish or pass on the whole report.
Is the EBITDARM a real operator's result?
No. It is an indicative figure for a typical older people's home in the area, built from the council's own cost of care data and published national margins, shown as a range. Always check a home's management accounts.
Where do the figures come from?
Official sources such as CQC, ONS, DHSC, NHS England, Companies House and HM Land Registry, plus the council's own documents. Every page lists its sources by number and the full references are at the end of the report.
How current is it?
The Q4 2026 edition uses CQC data to 1 October 2026 and Companies House to 13 October 2026. Reports are refreshed every quarter.
Which councils are ready?
Kent and West Sussex now. Every council has free headline figures on its council page, and you can ask to be told when its report is published.
Adviser licence, £895 + VAT
Ready now for Kent and West Sussex. Free headline figures for every council in England.